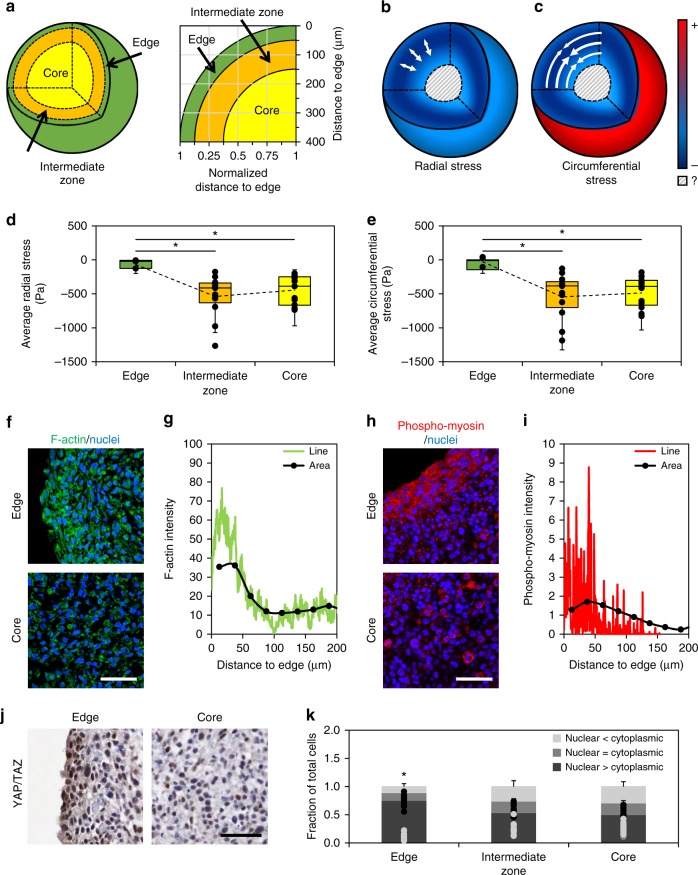
Fig. 5.
Characterization of mechanobiological markers within the MCS. a Schematic of MCS segregated into edge (50 μm from the free surface), intermediate (50–150 μm into MCS), and core zones. b, c Visual representation of b radial and c circumferential stresses within spheroid cultures, demonstrating compressional stresses in the core and intermediate zones, and a tensional ‘skin’ on the surface. d, e Quantification of average d radial and e circumferential stresses across the MCS at edge (n = 5), intermediate (n = 15), and core (n = 15) zones. Box plots indicate the median and first to third quartile, and the whiskers span the shorter of the range or 1.5× the interquartile range (*p < 0.05; one-way ANOVA with Tukey post-hoc pairwise comparisons). f Analysis of filamentous actin in sectioned spheroids reveals a highly organized cytoskeleton in cells around the MCS circumference (scale bar = 50 μm); quantified as g fluorescent line intensity graphs (green) and the average normalized to the selected area (black). h Phospho-myosin is differentially expressed at the MCS edge than in the core (scale bar = 50 μm); quantified as i fluorescence line intensity (red) and normalized to quantified area (black). These biomarkers suggest that spatial activation occurs in the MCS, and that the outer layer is responsible for generating contractile forces. j Immunohistochemistry for YAP/TAZ on sectioned spheroids shows significantly greater nuclear abundance at the edge compared to the core, indicating that the observed forces have biological significance in their ability to activate key signaling pathways (scale bar = 50 μm). k YAP/TAZ nuclear intensity was classified as either predominantly nuclear, predominantly cytoplasmic, or nuclear = cytoplasmic based on its relative abundance. There was a significant increase in the fraction of cells with nuclear>cytoplasmic YAP at the edge of the spheroid when compared to both the intermediate zone and the core. Data reported as mean ± standard deviation, n = 13, *p < 0.05 when compared to similar threshold levels at other spatial locations (one-way ANOVA with Tukey post-hoc pairwise comparisons)

