Fig. 3.
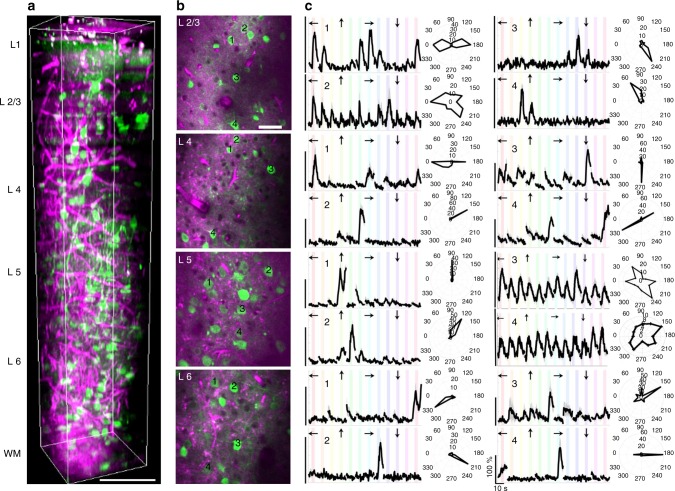
Characterization of visual responses of different layers in V1 of awake mice. a Three-dimensional rendering of a sequence of 450 lateral three-photon images acquired with 2-µm increment. Green color represents GCaMP6s signal, and magenta color represents label-free THG signal generated in the blood vessels in the visual cortex and myelin fibers in the white matter. Scale bar, 100 µm. b Selection of lateral images from layer 2/3, 4, 5, and 6. Scale bar, 50 µm. Field of view in all lateral images is 250 μm. c Average calcium responses (ΔF/F) for representative cells in each layer over 10 trials in response to oriented gratings moving in specific directions (arrows above each trace) and their orientation tuning curves in polar plots. Discontinuities in (ΔF/F) traces are due to the randomization of each stimulus direction in each trial. (ΔF/F) scale bars correspond to 100% and time scale bar corresponds to 10 s as shown in the bottom right panel

