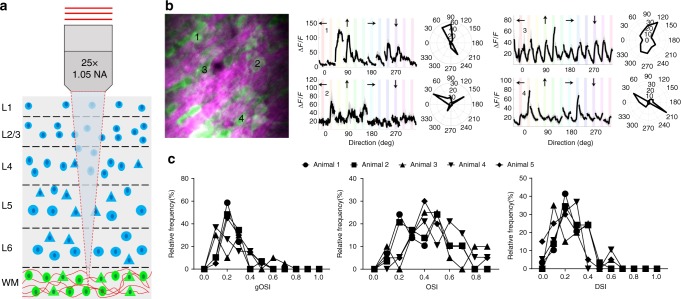
Fig. 5.
Characterization of visual responses of subplate neurons in the white matter below V1 layer 6. a Schematic coronal section of V1 showing locations of cortical (blue) and subplate (green) neurons surrounded by bundles of myelinated axons (red). b Left: Three-photon image of subplate neurons (green) and myelinated axons (magenta) in the white matter. Scale bar, 50 µm. Right: Average calcium responses (ΔF/F) for representative cells in response to oriented gratings drifting in specific directions (arrows above each trace) and their orientation tuning curves in polar plots. Discontinuities in (ΔF/F) traces are due to the randomization of each stimulus direction in each trial. c Population responses of subplate neurons showing global OSI, local OSI, and DSI. Total numbers of subplate neurons imaged in each animal are 43, 48, 38, 35, and 41

