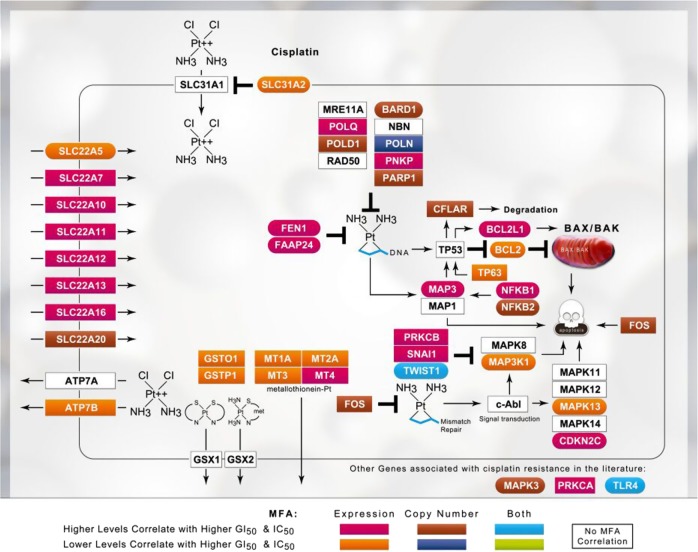
Fig. 1.
Schematic of platinum drug sensitivity and resistance genes that showed MFA correlation with the GI50 values for cisplatin. The gene products corresponding to those used to derive the SVM are indicated within boxes in the context of their cellular mechanisms of action and regulation of drug response. GE and CN correlations with inhibitory drug concentrations are based on the MFA of breast (GI50) and bladder (IC50) cancer cell line data. Gene products within the best-performing gene signature are embedded within color-coded ovals; whereas the other correlated gene products are embedded within rectangles

