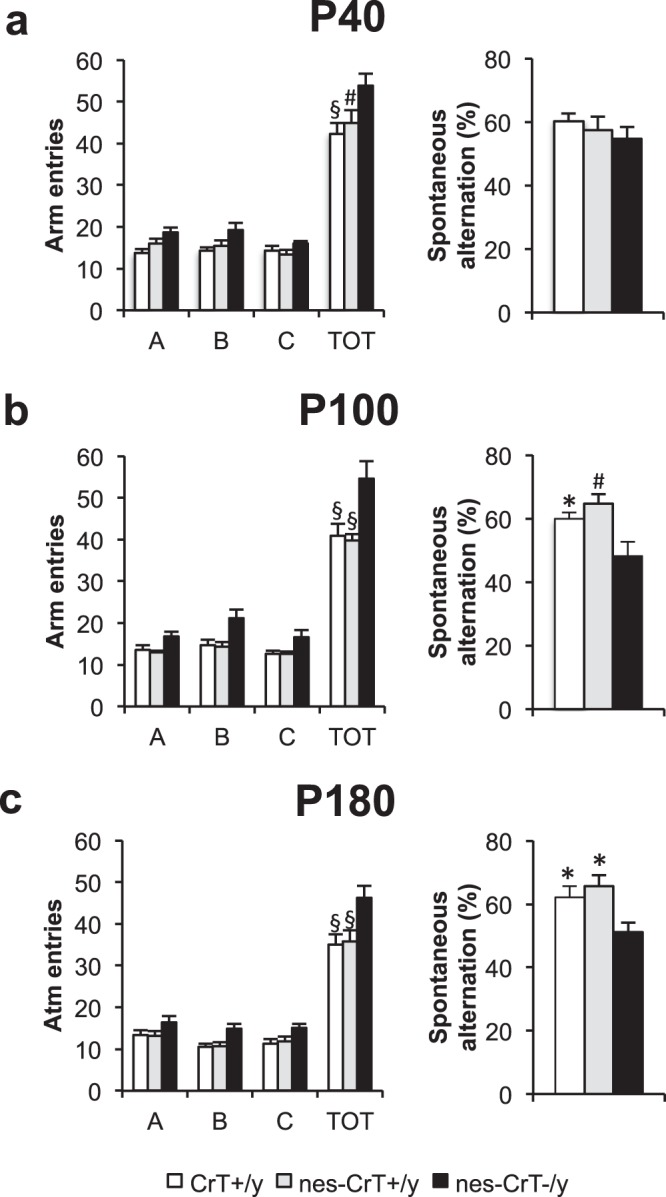
Figure 2.

At all ages tested, an effect of genotype (Two-Way ANOVA, p < 0.001, P40: F(2,100) = 9.791, P100: F(2,100) = 16.886, P180: F(2,84) = 10.595) and an effect of arm level (Two-Way ANOVA, p < 0.001, P40: F(3,100) = 221.487, P100: F(3,100) = 203.358, P180: F(3,84) = 158.430) were detected for the number of arm entries. A post hoc Holm-Sidak method revealed an higher number of total entries (TOT) scored for nes-CrT−/y mice (post hoc Holm-Sidak method, P40: p < 0.001 vs. CrT+/y, p < 0.01 vs. nes-CrT+/y; P100 and P180: p < 0.001 for both comparisons; Fig. 3a–c left side). In contrast, no difference was found in the number of entries in the single arms of the maze (A, B, C; Two-Way ANOVA, post hoc Holm-Sidak method), excluding a specific bias in arm choice. No difference in the Y maze performance was present among the three groups tested at P40 (CrT+/y, n = 13, nes-CrT+/y, n = 9, nes-CrT−/y, n = 6; One Way ANOVA, p = 0.417, F(2,25) = 0.906, panel a right side). In contrast, spontaneous alternation rate was significantly lower in nes-CrT–/y mice compared to that recorded for CrT+/y animals and nes-CrT+/y littermates at P100 (One Way ANOVA, p < 0.01, F(2,25) = 6.599, post hoc Holm-Sidak method, p < 0.05 vs. CrT+/y, p < 0.01 vs. nes-CrT+/y; panel b right side) and P180 (CrT+/y, n = 9, nes-CrT+/y, n = 9, nes-CrT−/y, n = 6; One Way ANOVA, p < 0.05, F(2,21) = 4.766, post hoc Holm-Sidak method, p < 0.05 for both comparisons; panel c right side). Symbols refer to post-hoc Holm Sidak comparisons between nes-CrT−/y mice and the genotype corresponding to the column on which the symbol is located: *p < 0.05, #p < 0.01. Error bars, s.e.m.
