
Figure 3.
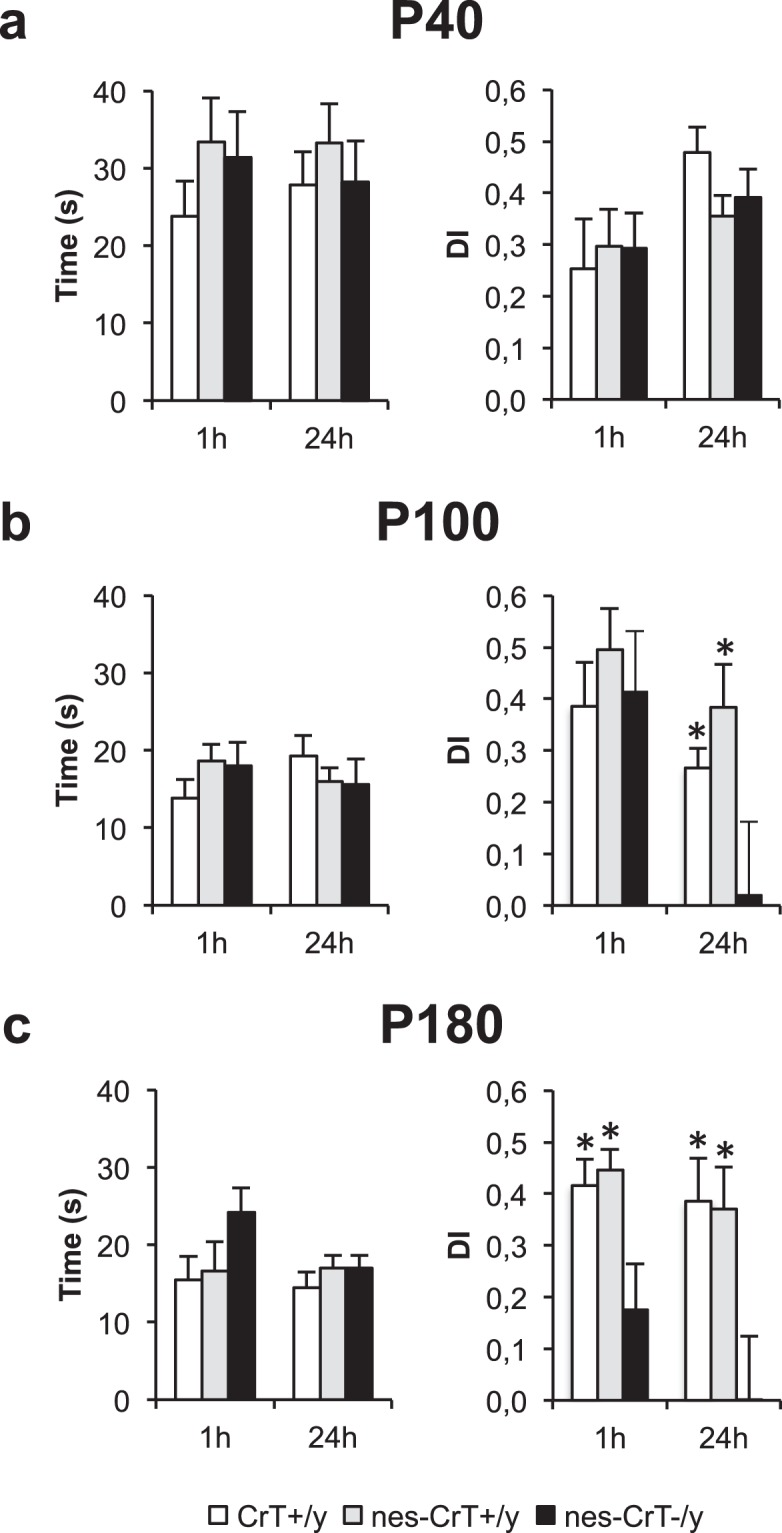
Left, diagrams describe total time of object exploration during the testing phase. (a,b,c) No difference was present among the different groups at all ages tested (One-Way ANOVA, P40: p = 0.372, F(2,22) = 1.036 for 1 h and p = 0.686, F(2,18) = 0.384 for 24 h; P100: p = 0.309, F(2,19) = 1.250 for 1 h and p = 0.531, F(2,21) = 0.653 for 24 h; P180: p = 0.194, F(2,19) = 1.792 for 1 h and p = 0.526, F(2,22) = 0.661 for 24 h). Right, histograms display object discrimination indexes (DIs) of CrT+/y, nes-CrT+/y and nes-CrT−/y during the testing phase performed after a delay of 1 and 24 h at different ages. (a) P40. The experimental groups (CrT+/y: n = 10, nes-CrT+/y: n = 8 and nes-CrT−/y: n = 6) can recognize the new object in the test both at 1 h (One Way ANOVA, p = 0.916, F(2,21) = 0.088) and at 24 h (p = 0.183, F(2,18) = 1.868). (b) P100. While the three experimental groups can recall the memory of the familiar object in the test at 1 h (One Way ANOVA, p = 0.671, F(2,19) = 0.408), a significantly lower discrimination index was found in nes-CrT–/y mice (n = 6) compared to CrT+/y (n = 10) and nes-CrT+/y animals at 24 h (n = 9; One Way ANOVA, p < 0.05, F(2,22) = 5.064, post hoc Holm Sidak method p < 0.05 for both comparisons). (c) P180. A significant deficit of both short (One Way ANOVA, p < 0.05, F(2,19) = 5.662; post hoc Holm Sidak method p < 0.05 for both comparisons) and long-term memory (One Way ANOVA, p < 0.05, F(2,22) = 3.990; post hoc Holm Sidak method p < 0.05 for both comparisons) was detected in mutant mice (n = 6) compared to controls (CrT+/y: n = 11, nes-CrT+/y: n = 9). Symbols refer to post-hoc Holm Sidak comparisons between nes-CrT−/y mice and the genotype corresponding to the column on which the symbol is located: *p < 0.05. Error bars, s.e.m.