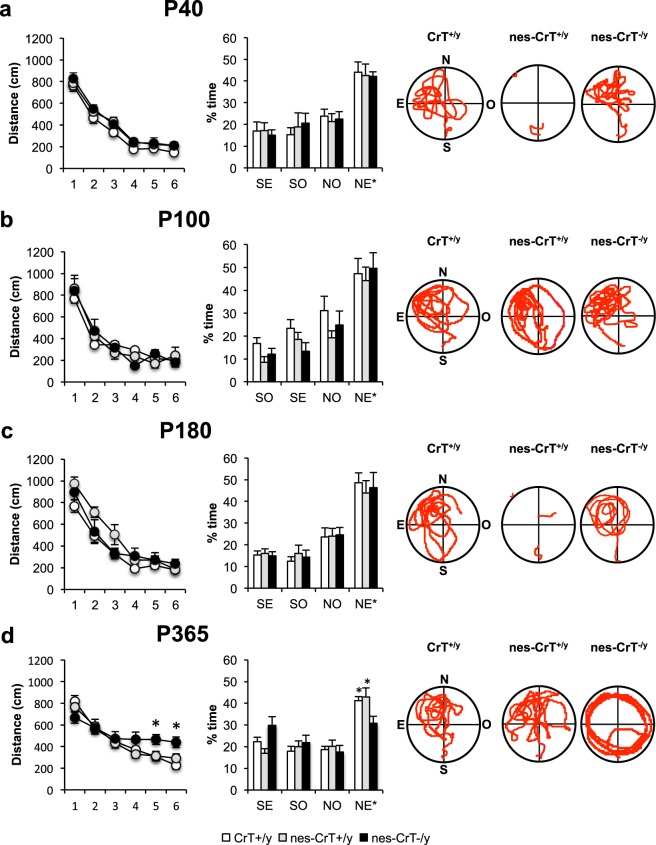
Figure 4.
Left, learning curves for CrT+/y (white), nes-CrT+/y mice (grey) and nes-CrT–/y (black) at P40 (a; CrT+/y: n = 10, nes-CrT+/y: n = 5, nes-CrT−/y: n = 5), P100 (b; CrT+/y: n = 7, nes-CrT+/y: n = 5, nes-CrT−/y: n = 5), P180 (c; CrT+/y: n = 9, nes-CrT+/y: n = 6, nes-CrT−/y: n = 5) and P365 (d; CrT+/y: n = 12, nes-CrT+/y: n = 14, nes-CrT−/y: n = 12). No significant difference was detected along the training phase at P40 (Two way RM ANOVA, interaction genotype x day p = 0.999, F(10,85) = 0.127), P100 (interaction genotype x day p = 0.464, F(10,70) = 0.986) and P180 (Two way RM ANOVA on rank transformed data, interaction genotype x day p = 0.748, F(10,85) = 0.671). In contrast, 1-year old nes-CrT−/y animals were poorer learners with respect to control groups, with a significantly longer distance covered at day 5 and 6 of training (Two way RM ANOVA, interaction genotype x day p < 0.05, F(10, 175) = 2.334; post hoc Holm-Sidak method, p < 0.05 for all comparisons at day 5, p < 0.01 vs. CrT+/y, p < 0.05 vs. nes-CrT+/y at day 6). Right, histograms showing the mean time percentage spent in the four quadrants during the probe trial. No significant difference among the three groups was present at P40 (a; Two way RM ANOVA, interaction genotype x quadrant p = 0.985, F(6,51) = 0.167), P100 (b; interaction genotype x quadrant p = 0.856, F(6,42) = 0.428) and P180 (c; interaction genotype x quadrant p = 0.985, F(6,51) = 0.166). At all ages, CrT+/y, nes-CrT+/y, nes-CrT–/y spent significantly more time in the NE* target quadrant (Two way RM ANOVA, post hoc Holm Sidak method, p < 0.05 for all comparisons). At P365 (d), a Two-Way RM ANOVA detected a significant interaction genotype x quadrant (p < 0.05, F(6,105) = 2.534): post hoc Holm-Sidak multiple comparisons revealed that nes-CrT−/y mice did not show any preference for the target quadrant (p = 0.296 NE* vs. SO, p = 0.850 NE* vs SE, p = 0.060 NE* vs. NO), while CrT+/y and nes-CrT+/y spent significantly more time in the NE* target quadrant (p < 0.01 for all comparisons in CrT+/y, p < 0.001 for all comparisons in nes-CrT+/y). The percentage of time spent in the target quadrant was shorter in nes-CrT−/y mice than in the other two control groups (p < 0.05 for both comparisons). Representative examples of the swimming path during the probe session for a CrT+/y, a nes-CrT+/y and a nes-CrT−/y mouse are also depicted. Symbols refer to post-hoc Holm Sidak comparisons between nes-CrT−/y mice and the genotype corresponding to the column on which the symbol is located: *p < 0.05. Error bars, s.e.m.

