Fig. 3.
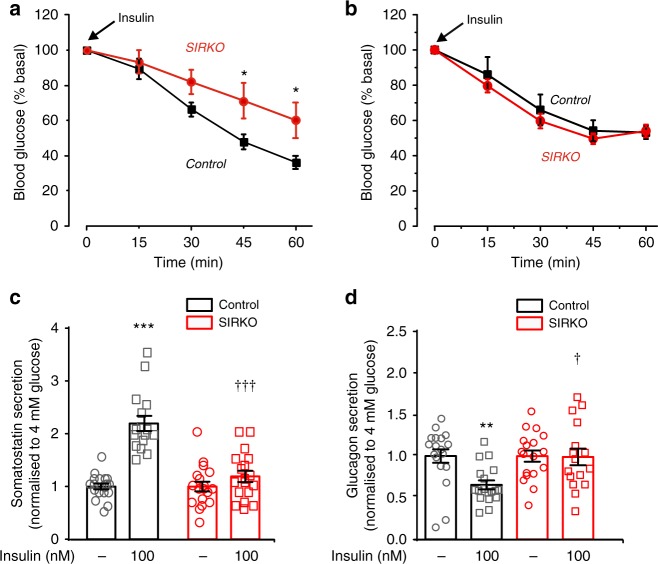
Insulin’s glucagonostatic effect mediated by InsR in δ cells. a, b Insulin tolerance test. Plasma glucose concentrations following injection of insulin (at t = 0; 1.5 U/kg) in female (a) and male (b) controls (black; n = 10 female and 6 male mice) and δ-cell-specific insulin receptor knockout (SIRKO, red; n = 9 female and 6 male mice) mice. *p < 0.05 vs control, two-way ANOVA followed by Sidak’s post hoc test. c, d Somatostatin (c) and glucagon secretion (d) at 4 mM glucose in the absence or presence of insulin (100 nM) in islets from control (black; n = 20/4 mice) or SIRKO (red: n = 18 with insulin and 20 without insulin/4 mice) mice. Responses have been normalised to secretion at 4 mM glucose. **p < 0.01, ***p < 0.001 vs 4 mM glucose; †p < 0.05 and †††p < 0.001 vs 4 mM glucose and 100 nM insulin in control islets, two-way ANOVA followed by Sidak’s post hoc test. Data are presented as dot plots of individual experiments and/or mean values ± S.E.M. of all experiments with the experimental series

