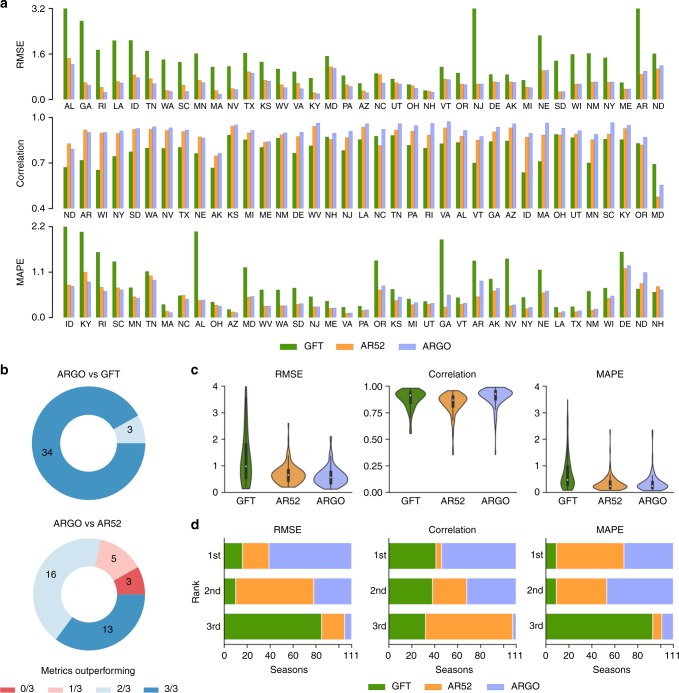
Fig. 1.
Summary of ARGO performance benchmarked with GFT and AR52. a State-level performance of ARGO and benchmarks, as measured by RMSE (top), Pearson correlation (middle), and MAPE (bottom), over the period from September 30, 2012 to August 15, 2015. Extreme GFT error values are displayed up to a cutoff point. States are ordered by ARGO performance relative to the benchmarks to facilitate comparison. b The proportion of states where ARGO outperforms GFT (top) or AR52 (bottom) in 0, 1, 2, or all 3 metrics. c The distribution of values for each metric for each model, over the 111 state-seasons during the same period. The embedded boxplots indicate median and interquartile ranges. Numerical values are reported in Supplementary Table 1. d The distribution of ranks attained by each model over the 111 state-seasons for each metric

