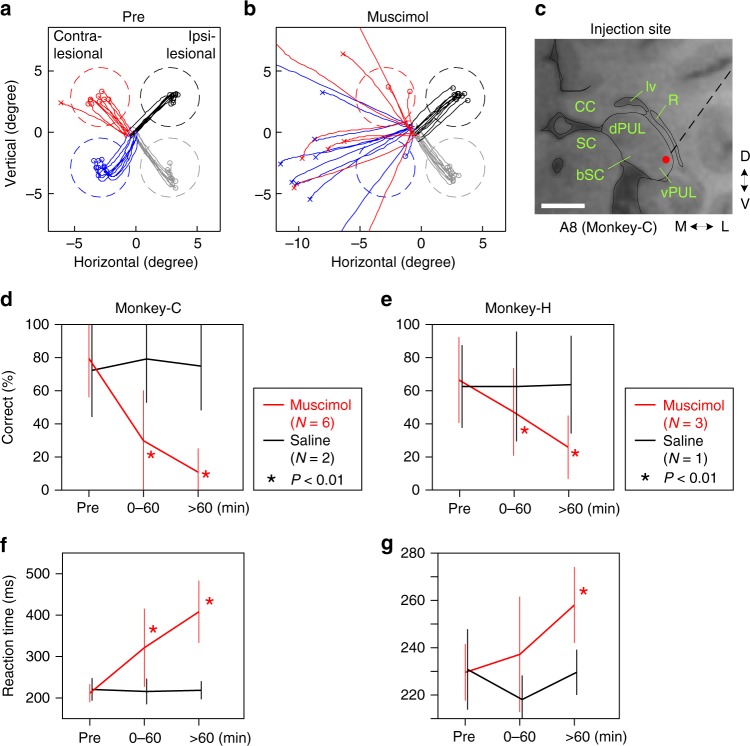
Fig. 3.
Inactivation of the vlPul impaired the VGS. a, b Representative trajectories of saccades in the VGS task before (a) and 60 min after (b) the injection of 0.5 μL muscimol. The target was presented at the center of the dashed circle, which indicates the target window. The saccade endpoint was depicted as o (correct saccade, inside of the window) or x (fail, outside). Different color corresponds to the difference of target location. The target contrast was 0.85. c Red dot indicates the injection site for b. The dashed line indicates the penetration of the injection needle. Scale bar: 5 mm. d, e The averaged ratios of the correct saccade for each time window (Pre: before injection. 0–60: 0 to 60 min after the injection. >60: after 60 min. Red line: muscimol injection. Black line: saline injection). The correct ratios were significantly decreased in muscimol injections (asterisk: P < 0.01, t test, compared with pre) in both monkeys. No significant difference was found in saline injections (P > 0.05, t test). The number of days used for the average is indicated as N in each inset. Error bar indicates SD. The target contrast was 0.85 for Monkey-C and 0.6 for Monkey-H. Number of trials for each target in each time window were 4–11 for Monkey-C and 7–23 for Monkey-H. Number of targets for the average were 21 for Monkey-C and 12 for Monkey-H. Non-averaged results are shown in Supplementary Figure 2. f, g The averaged VGS reaction time is plotted in the same manner as d, e, respectively. The prolonged reaction time was observed after the muscimol injection in both monkeys

