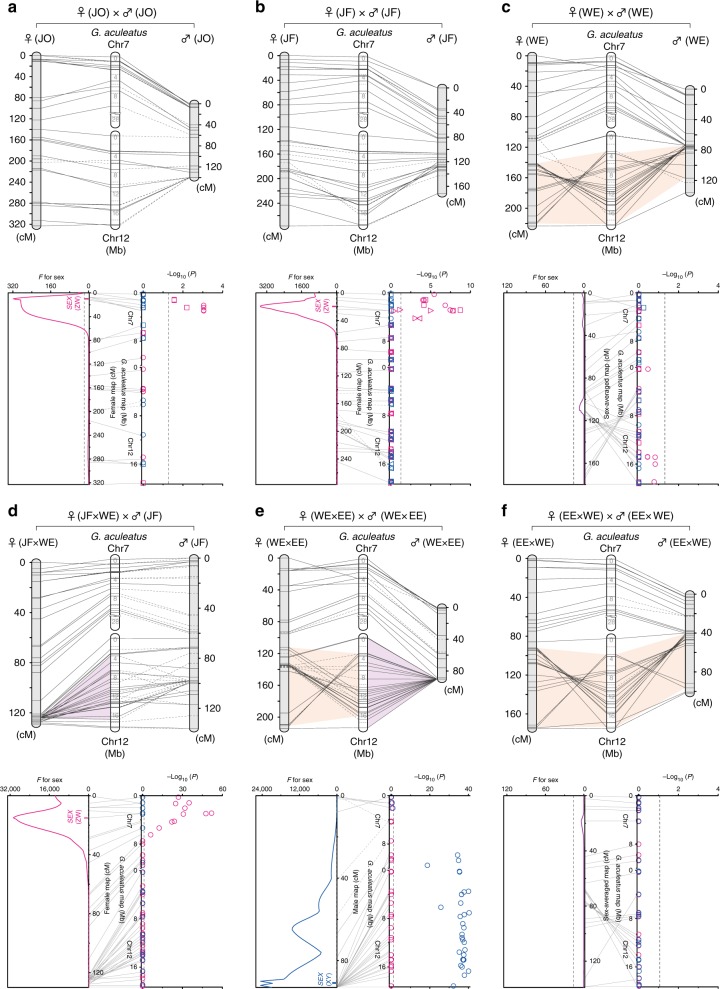
Fig. 2.
Comparative genetic maps and sex determination systems. Comparative genetic maps of Pungitius LG12 and G. aculeatus Chr7 and Chr12 in the JO lineage (a), the JF lineage (b), the WE lineage (c), a backcross between an F1 hybrid female (JF female × WE male) and a JF male (d), and F2 crosses between a WE female and an EE male (e) and between an EE female and a WE male (f). Female and male maps are shown to the left and right of G. aculeatus physical maps, respectively, on the top. Orange shaded areas indicate large inverted chromosomal regions between Pungitius and G. aculeatus, whereas purple shaded areas indicate non-recombining chromosomal regions. Dashed lines in comparative maps indicate uninformative (i.e., non-segregating) loci in the corresponding sex. QTL positions for sex and significance levels of associations between sex and loci are shown in the graphs to the left and right at the bottom, respectively. Dashed lines indicate statistically significant levels (P = 0.05). The means and 95% confidence intervals of QTL positions are indicated to the left of the map positions. In the graphs on the right, maternally and paternally segregating alleles are indicated in red and blue, respectively. Different symbols represent data from different families

