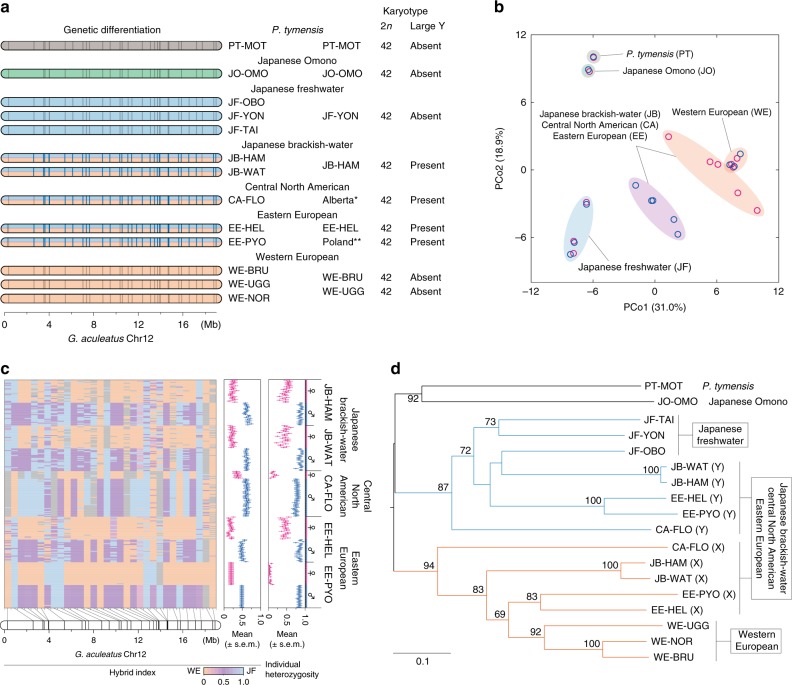
Fig. 3.
Genetic differentiation and evolutionary relationships of X and Y chromosomes. a Sex-specific genetic differentiation in the region of G. aculeatus Chr12 and the presence or absence of a large male-specific chromosome in 13 populations from seven lineages. Loci with male-specific alleles are indicated in blue. Locus positions are based on the G. aculeatus genome. Different chromosome colors represent different origins, as indicated by phylogenetic analyses based on G. aculeatus Chr12 loci (see d). Karyotype data for Alberta* and Poland** are based on Ross et al.15. and Ocalewicz et al.16, respectively. b Principal coordinate analysis among 13 populations. PCo1 and PCo2 values are plotted on the x and y axes, respectively. Females (red) and males (blue) are indicated separately. c The hybrid index and individual heterozygosity of each individual from five populations belonging to three lineages with an XY sex determination system. Hybrid index estimates are given for each locus. The hybrid index is expected to be 0 or 1 when a locus has two alleles unique to the WE or JF lineages, respectively, and 0.5 when a locus has two alleles, each of which is present in a different lineage. The hybrid index level for each locus is represented with a color gradient. Uninformative loci are shown in gray. Mean hybrid index values and individual heterozygosity are given for each individual. Bars represent standard error of the mean. Female and male individuals are shown in red and blue, respectively. d Phylogenetic relationships among 13 populations based on G. aculeatus Chr12 loci. X- and Y-chromosomal haplotype data are used for three lineages with an XY sex determination system. Bootstrap values (≥60) are given near the nodes. The tree is rooted at the midpoint

