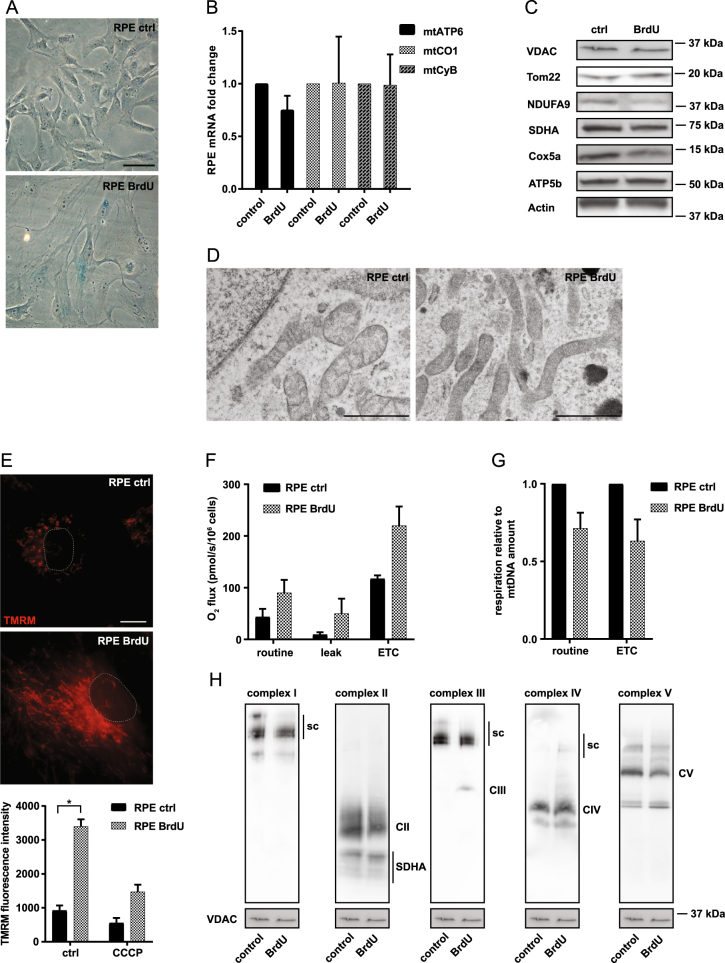
Fig. 2.
a RPE-1 cells were treated with 100 μM BrdU for 8 days and assessed for β-gal positivity. Scale bar represents 50 μm. b Expression of mtATP6, mtCO1 and mtCyB genes in RPE-1 control and senescent (BrdU) cells was detected by qRT-PCR. c RPE-1 control and senescent (BrdU) cells were assessed for VDAC, Tom22, NDUFA9, SDHA, Cox5a and ATP5b protein levels using immunoblotting. β-actin was used as a loading control. d Structure of mitochondria in RPE-1 control and senescent (BrdU) cells was imaged using transmission electron microscopy. Scale bar represents 1 μm. e RPE-1 control and senescent cells (BrdU) treated or not with CCCP (10 μM) were assessed for mitochondrial potential using TMRM combined with immunofluorescence microscopy (upper panel) or flow cytometry (lower panel). Scale bar represents 10 μm. f RPE-1 control and senescent cells (BrdU) were evaluated for routine, leak, and ETC respiration. g Respiration of RPE-1 control and senescent cells (BrdU) related to mtDNA amount. h Mitochondrial fraction from RPE-1 control and senescent (BrdU) cells was probed for respiratory complexes and supercomplexes (sc) by western blotting following NBGE using the following antibodies: CI, NDUFA9; CII, SDHA; CIII, UQCRC2; CIV, Cox5a; and CV, ATPβ; VDAC was used as loading control. The asterisk represents p < 0.05

