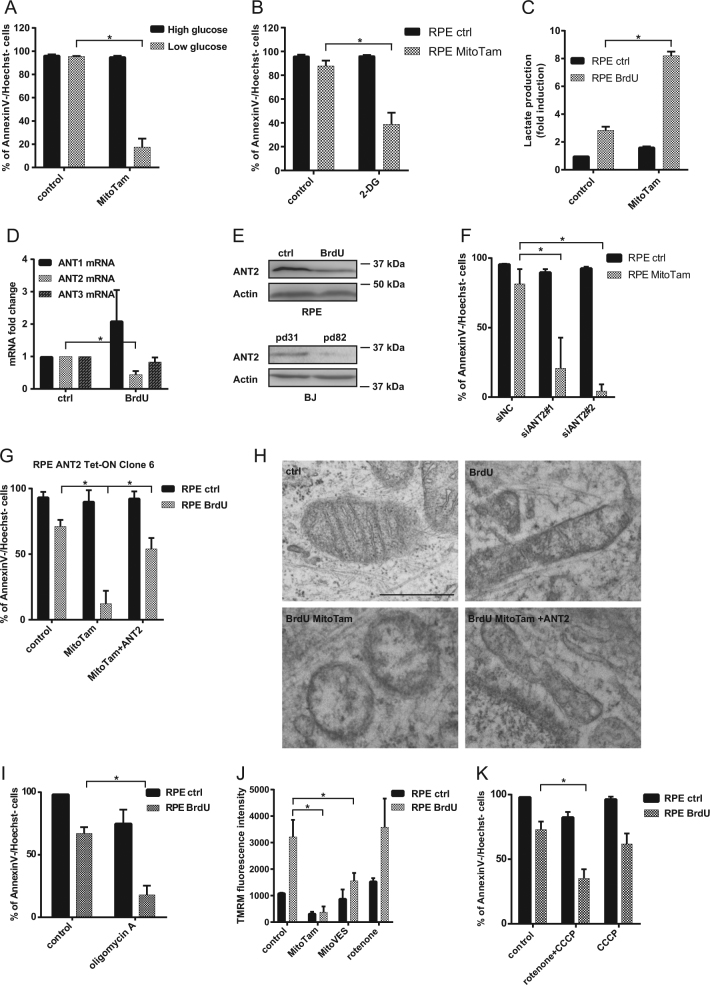
Fig. 5.
RPE-1 control cells were exposed to MitoTam (2.5 μM) for 48 h in high (4.5 g/L) and low (1 g/L) glucose medium (a) or in the presence of 2-deoxyglucose (2-DG; 25 mM) (b), and cell survival was evaluated by annexin V/Hoechst negativity using flow cytometry. c RPE-1 control and senescent cells (BrdU) were exposed to MitoTam (2.5 μM) for 48 h and lactate level was assessed. d Expression of ANT1, ANT2 and ANT3 transcripts in RPE-1 control and senescent (BrdU) cells were detected by qRT-PCR. e Control and senescent (BrdU) RPE-1 cells, as well as BJ control (pd 31) and senescent (pd 82) cells were assessed for the level of the ANT2 protein by western blotting. β-actin was used as loading control. f RPE-1 control cells were exposed to MitoTam (2.5 μM) for 48 h after downregulation of ANT2 using specific siRNAs, and their survival was evaluated by annexin V/Hoechst negativity using flow cytometry. g RPE-1 control and senescent (BrdU) cells, as well as their ANT2-overexpressing counterparts, were exposed to MitoTam (2.5 μM) for 48 h and viability was evaluated as annexin V/Hoechst negativity by flow cytometry. h Structure of mitochondria in RPE-1 control and senescent (BrdU) cells as well as their ANT2-overexpressing counterparts exposed to MitoTam (2.5 μM) for 24 h were assessed for mitochondrial morphology using transmission electron microscope. Scale bar represents 1 μm. i RPE-1 control and senescent (BrdU) cells were exposed to oligomycin A (5 μM) for 48 h and their survival was evaluated by annexin V/Hoechst negativity using flow cytometry. j Control and senescent (BrdU) RPE-1 cells were exposed to MitoTam (2.5 μM), MitoVES (2.5 μM) or rotenone (0.5 μM) for 24 h, and the cells were assessed for ΔΨm,i using TMRM and flow cytometry. k RPE-1 control and senescent (BrdU) cells were exposed to rotenone (0.5 μM) in combination with CCCP (10 μM) for 48 h and their survival was evaluated by annexin V/Hoechst negativity using flow cytometry. Data in all graphs represent means ± S.D. from three independent experiments. The asterisk represents p < 0.05

