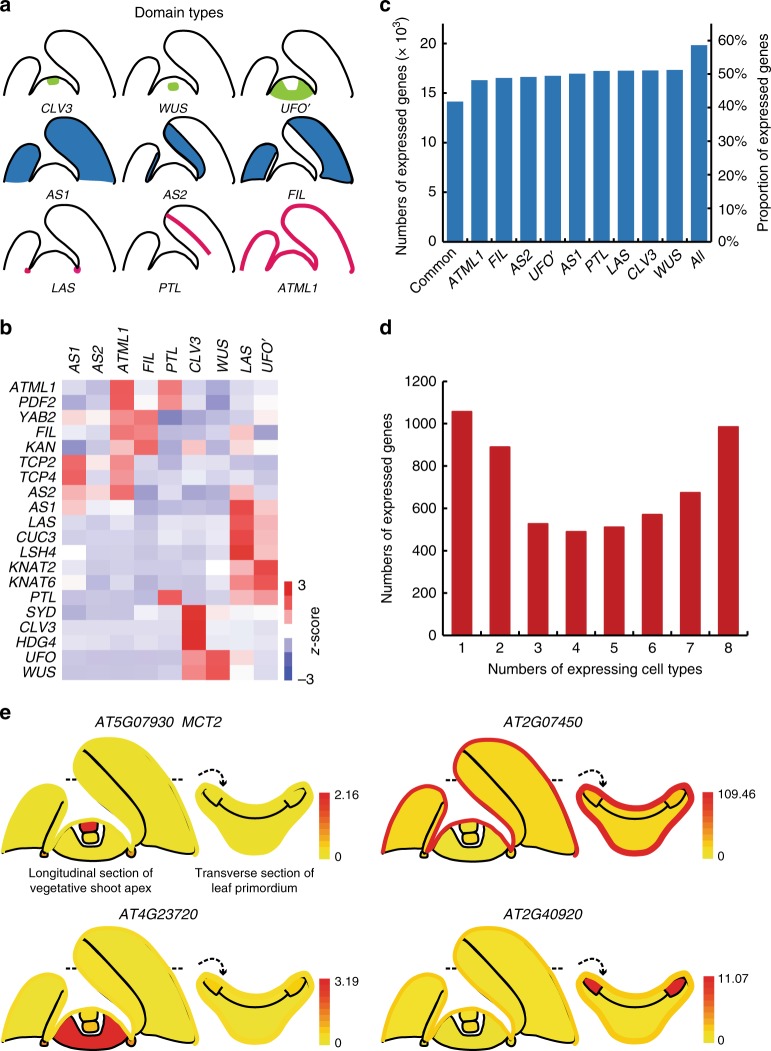
Fig. 1.
Properties of cellular gene expression. a Diagrams showing different spatial domains being profiled. b Marker gene expression pattern in different cellular transcriptomes. Relative expression (z-score) is displayed in colors, in which red indicates enrichment and blue indicates depletion as shown. Labels on the top show domains. The gene names are shown on the left. c Numbers and proportion of expressed genes in each domain. d Numbers of expressed genes in multiple domain groups. e eFP browser view of expression changes in the shoot apex for selected genes. Whereas MEI2 C-TERMINAL RRM ONLY LIKE 2 (MCT2, AT5G07930) is a previously identified CZ-specific gene21, all others are unknown domain-specific genes. Absolute gene expression values were calculated and shown for each domain

