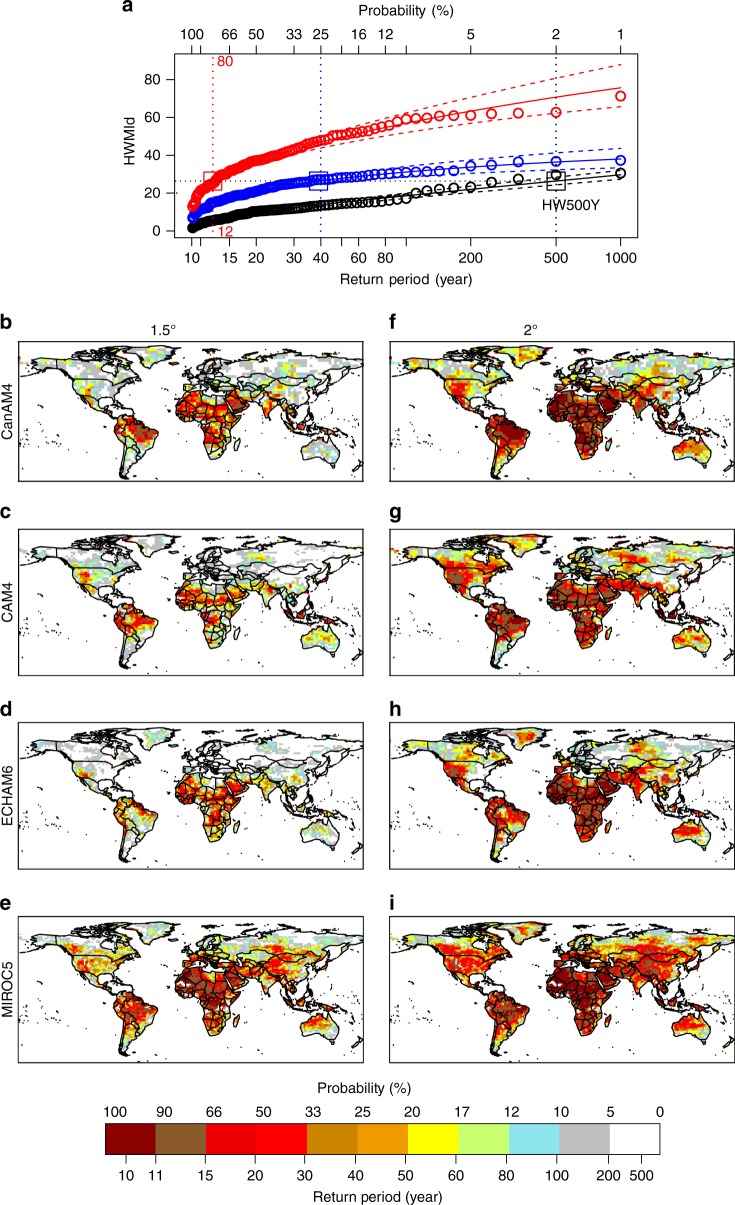
Fig. 1.
Probability of occurrence of extreme heatwave. a Extreme value analysis GEV-fit for decadal-maximum HWMId at a location in Central Africa Republic (18.75°E, 4.69°N) as a function of return period (bottom x-axis) and hazard (upper x-axis expressed as decreasing probability) at present climate (black curves), 1.5 °C (blue curves) and 2 °C (red curves) warming levels. The colored dashed curves give the 95%-confidence interval, based on a likelihood estimates (see method), and the open colored circles are the simulated decadal-maximum HWMId values. The open squares represent the 500-year return level heatwave (HW500y) in present climate (black) and at 1.5 and 2 °C level of warming, blue and red, respectively. b–i Spatial distribution of the probability and return level of a heatwave with five-hundred years return period under 1.5 °C (b–e) and 2.0 °C (f–i) warming for multiple models

