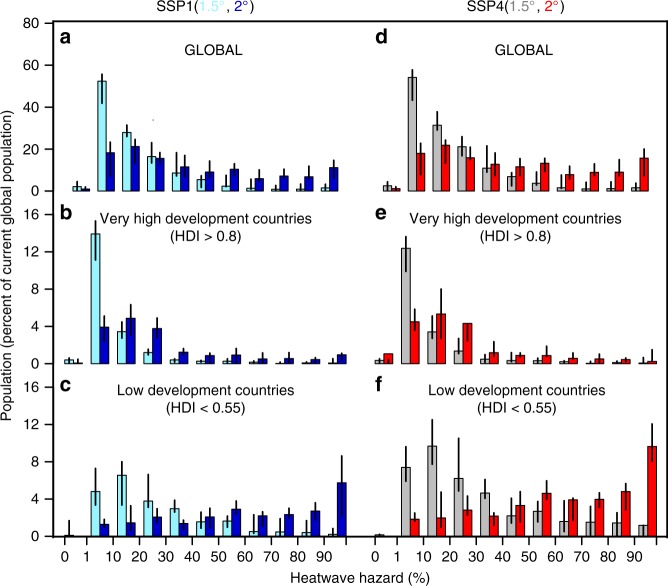
Fig. 2.
Population exposure to heatwave hazard. a Bar plots show the ensemble model median, with associated range represented by black lines, of the global population in 2075 exposed to different probabilities of HW500Y events occurring in a given decade at 1.5 °C(gray bars) and 2 °C(red bars) warming and under the SSP1 pathway. Population in 2075 is expressed as a percentage of the current global population. The bar plots are calculated for all the grid points of the global domain with population density greater than 0. b, c as for a, but for very high and low-human-development countries with HDI > 0.8 and HDI < 0.55, respectively. d–f as a–c, respectively, but for the SPP4 scenario

