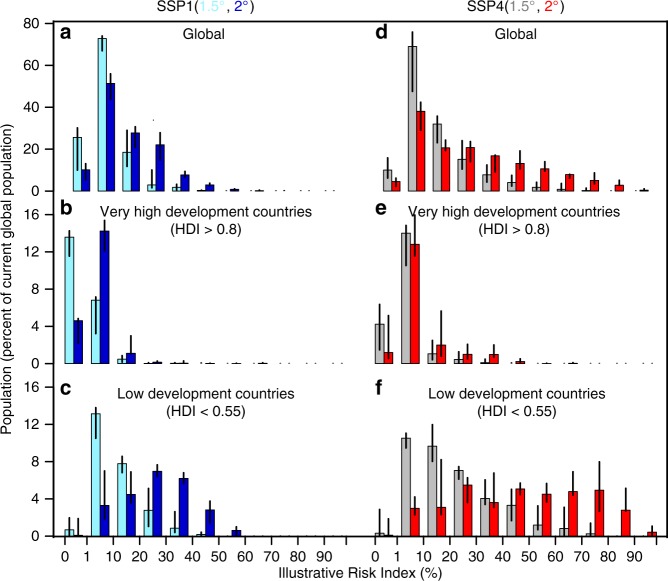
Fig. 4.
Population as function of IRI. a Bar plots show the ensemble model median, with associated range represented by black lines, of the population in 2075 (measured as percent of current global population) that experiences different IRI levels at 1.5 °C(gray bars) and 2 °C(red bars) warming, and under the SSP1 pathway. The bar plots are calculated for all the grid points of the global domain with population density greater than 0. b, c as for a, but for population in countries with HDI > 0.8 and HDI < 0.55, corresponding to very high and low-human-development countries, respectively. d–f as for a–c, respectively, but for the SPP4 pathway

