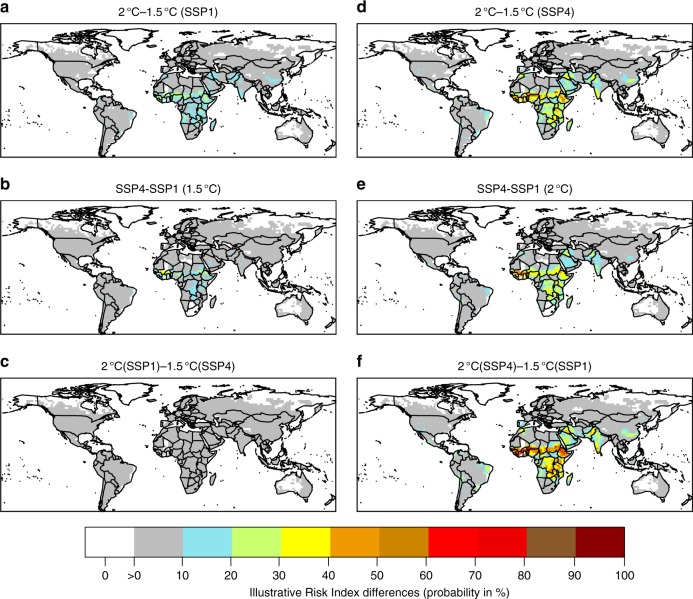
Fig. 5.
Differences in Normalized IRI. Normalized IRI differences are calculated at each grid point by means of IRI values for the ECHAM6 model. a, d Differences of IRI between 2 and 1.5 °C under the low vulnerability (SSP1) and high vulnerability (SSP4) scenarios, respectively. b, e Differences of IRI between SSP4 and SSP1 for the 1.5 and 2 °C warming levels, respectively. c Differences of IRI between 2 °C under the SSP1 scenario and 1.5 °C under the SSP4 scenarios. c, f Differences of IRI between the most pessimistic (2 °C level of warming under the SSP4 scenario) and most optimistic (1.5 °C level of warming under the SSP1 scenario) scenarios

