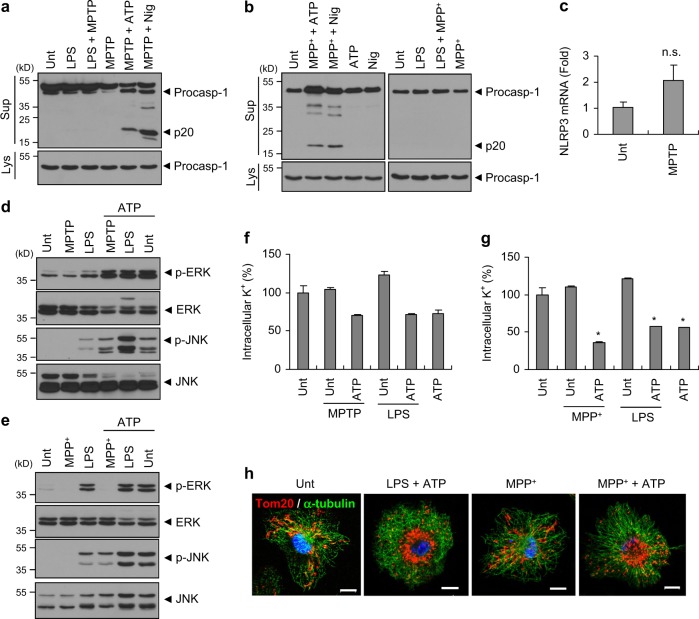
Fig. 5.
MPTP or MPP+ treatment alone does not induce the activation of mitogen-activated protein kinases and the efflux of potassium. a Immunoblots from mouse mixed glial cells untreated (Unt) or primed with LPS (0.25 μg ml−1, 3 h), followed by MPTP (40 μM, 14 h), or primed with MPTP, followed by ATP (2 mM, 40 min) or nigericin (5 μM, 45 min) treatment. b Immunoblots from mouse BMDMs untreated (Unt) or primed with MPP+ (100 μM, 6 h), followed by ATP (2.5 mM, 45 min) or nigericin (5 μM, 45 min, left panel), or primed with LPS (0.25 μg ml−1, 3 h), followed by MPP+ (100 μM, 6 h, right panel). c Cellular levels of NLRP3 mRNA in mouse mixed glial cells untreated or treated with MPTP (40 μM) for 18 h. (n = 7). d, e Immunoblots from mixed glial cells (d) or BMDMs (e) untreated or treated with MPTP (40 μM, 10 h, (d)), MPP+ (100 μM, 6 h, (e)) or LPS (0.25 μg ml−1, 3 h), followed by ATP treatment (2 mN, 40 min). a, b, d, e Culture supernatants (Sup) or cellular lysates (Lys) were immunoblotted with the indicated antibodies. f, g Intracellular K+ levels of mixed glial cells (f) or BMDMs (g) untreated or primed with MPTP (40 μM, 16 h, (f)), MPP+ (100 μM, 6 h, (g)) or LPS (0.25 μg ml−1, 3 h), followed by ATP (2 mM, 40 min) (n = 2, (f); n = 2, (g)). Asterisks indicate significant differences compared with untreated group (*P < 0.05). h Representative immunofluorescence images of mouse BMDMs untreated or treated with LPS (0.25 μg ml−1, 3 h), MPP+ (100 μM, 6 h), followed by ATP (2 mM, 40 min) treatment as stained with anti-Tom20 (red) and anti-α-tubulin (green) antibodies. DAPI represents the nuclear signal (blue). Scale bars, 10 μm

