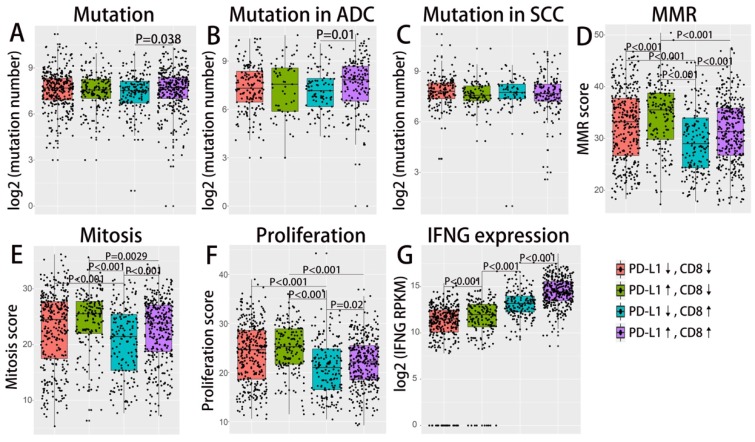
Figure 3.
Difference in mutation burden, MMR, IFN γ expression etc. across TIMTs defined by PD-L1/CD8+ TIL combination. Box plot of the number of total somatic mutations (log 2-transformed) (A-C), MMR score (D), mitosis score (E), proliferation score (F), IFNG mRNA expression value (log 2-transformed) (G) according to TMITs (PD-L1↓/CD8↓, red; PD-L1↑/CD8↓, green; PD-L1↓/CD8↑, blue; PD-L1↑/CD8↑, purple) are plotted. Abbreviation: MMR, mismatch repair; RPKM, reads per kilobase of transcript per million reads mapped.

