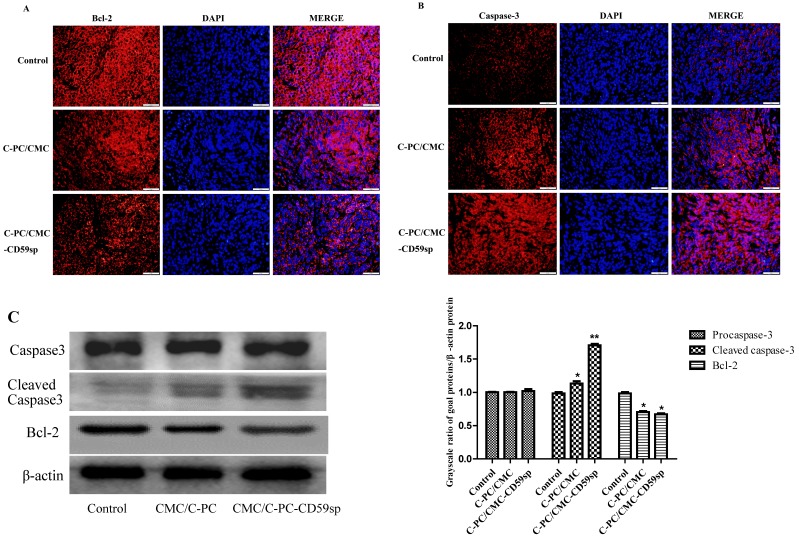
Figure 6.
Nanoparticles regulated Bcl-2/ Cleaved caspase-3 protein level in vivo. (A) Analysis of Bcl-2 protein level in vivo by immunofluorescent assay. Nanoparticles down-regulated Bcl-2 protein level in vivo. (B) Analysis of Cleaved caspase-3 protein level in vivo by immunofluorescent assay. Nanoparticles up-regulated Cleaved caspase-3 protein level in vivo. (C) Analysis of Bcl-2/Cleaved caspase-3 protein level in vivo by Western blotting. Quantitative representation of grayscale ratio of target protein/β-actin. *P<0.05 vs control group and ** P<0.01 vs control group.

