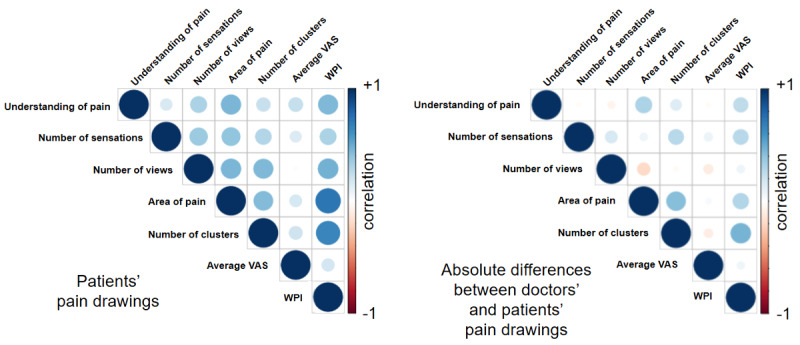
Figure 5.

Factors with the potential to influence doctors’ understanding of the patients. The left image shows correlations of pain drawing characteristics extracted from the patients’ drawings, whereas the right image is based on absolute differences of those characteristics between patients’ and doctors’ drawings. Correlation strength is encoded in color brightness and circle size. Blue color indicates positive values and red color indicates negative values. Both the areas of pain (in percent body area) and the widespread pain index (WPI) showed significant correlations with the doctors’ understanding of pain. VAS: visual analog scale.
