FIGURE 4:
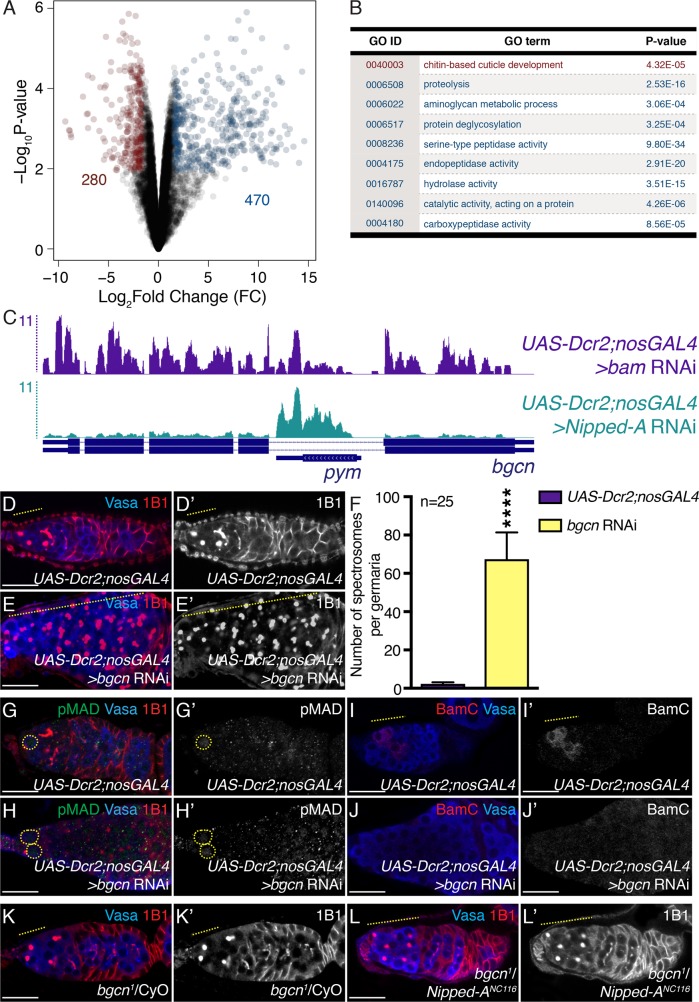
Nipped-A regulates bgcn levels. (A) Volcano plot of log2 fold change (FC) vs. –log10 P value. Red dots represent significantly down-regulated transcripts, and blue dots represent significantly up-regulated transcripts in Nipped-A RNAi ovaries compared with bam RNAi ovaries (FDR = 0.05). Genes with threefold or higher change were considered significant. Two-hundred eighty genes were significantly down-regulated while 470 genes were significantly up-regulated. (B) Table representing the Gene Ontology analysis carried out on differentially expressed genes in Nipped-A–depleted ovaries compared with bam-depleted ovaries. GO: 0040003 was identified from significantly down-regulated genes (red), while GO: 0006508, GO: 0006022, GO: 0006517, GO: 0008236, GO: 0004175, GO: 0016787, GO: 0140096, and GO: 0004180 were identified from significantly up-regulated genes (blue). (C) UCSC genome browser view of bgcn locus and pym intervening locus. Germline-depleted bam and Nipped-A reads shown on top (purple and teal, respectively). RefSeq annotations (bottom, blue) indicate that germline-depleted Nipped-A has reads mapping to Partner of Y14 and Mago (pym); pym reads do not change but reads mapping to bgcn are lower in germline-depleted Nipped-A. (D, D′) Control and (E, E′) germline-depleted bgcn germaria stained with Vasa (blue) and 1B1 (red). Germaria depleted of bgcn show accumulation of single cells (yellow dashed line). 1B1 channel is shown in D′ and E′. (F) Quantitation of the number of single cells in control and germline-depleted bgcn germaria (67.36 ± 13.99 in bgcn RNAi compared with 2.28 ± 0.84 in UAS-Dcr2;nosGAL4 control; n = 25 for both, ****P < 0.0001). (G, G′) Control and (H, H′) germline-depleted bgcn germaria stained with pMAD (green), Vasa (blue), and 1B1 (red). Germaria depleted of bgcn do not accumulate pMAD-positive germ cells (yellow dashed circle) (n = 25, P = 0.1189). pMAD channel is shown in G′ and H′. (I, I′) Control and (J, J′) germline-depleted bgcn germaria stained with BamC (red) and Vasa (blue). Germaria depleted of bgcn do not accumulate BamC-positive germ cells (yellow dashed line in control) (n = 25 for both). BamC channel is shown in I′ and J′. (K, K′) bgcn heterozygote and (L, L′) bgcn/Nipped-A trans-heterozygote germaria stained with Vasa (blue) and 1B1 (red). Trans-heterozygote shows accumulation of single cells (yellow dashed line) (n = 25). 1B1 channel is shown in K′ and L′. Statistical analysis performed with Student’s t test for all except for Chi-square for I–J′. Scale bar for all images is 20 μm.

