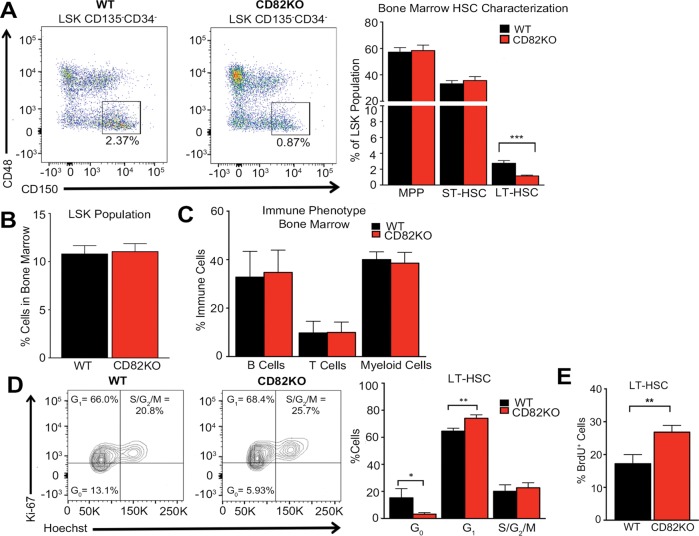
FIGURE 1:
CD82 expression maintains LT-HSCs within the bone marrow. (A) Representative flow cytometry plots of LT-HSCs gated on the LSK CD135-CD34-CD48-CD150+ population. Flow cytometry analysis of the percentage of MPP, ST-HSC, and LT-HSCs from the bone marrow LSK population of WT and CD82KO mice. Error bars, SEM: n = 8–9 mice per strain (***p < 0.001). (B) Flow cytometry analysis of the percentage of the LSK population from WT and CD82KO mice. n = 8 mice per strain. (C) Flow cytometry analysis of the percentage of immune cells (B-cells [B220], T-cells [CD3], and myeloid cells [Gr1/Mac1]) within the bone marrow of WT and CD82KO mice. n = 15 mice per strain. (D) Flow cytometry plots of DNA (Hoechst) and the proliferative nuclear antigen (Ki-67) expression of the bone marrow to measure the cell cycle status of LT-HSC population from WT and CD82KO mice. Error bars, SEM; n = 3 independent experiments (*p < 0.05 and **p < 0.01). (E) Flow cytometry analysis of BrdU expression in the LT-HSC population after 3 d of BrdU incorporation in vivo. Error bars, SEM; n = 3 independent experiments (**p < 0.01).

