FIGURE 2:
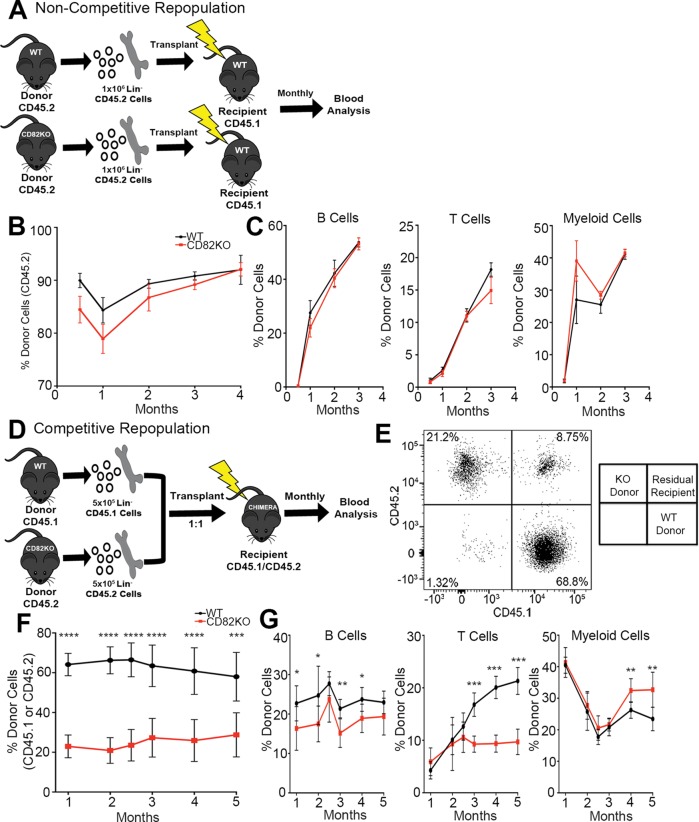
CD82KO HSPCs display decreased repopulation in a competitive environment. (A) Experimental scheme for the noncompetitive repopulation experiment. (B) The percentage of donor cell repopulation of peripheral blood collected monthly from tail bleeds. Donor cell chimerism (CD45.2) status measured via flow cytometry. n = 6 mice per strain, (C) Flow cytometry analysis of the percentage of donor immune cells (B-cells [B220], T-cells [CD3], and myeloid cells [Gr1/Mac1]) from donor (CD45.2) population in B. (D) Experimental scheme for the competitive repopulation experiment. (E) Representative flow cytometry plot for the competitive repopulation assay gated for donor cells (WT, CD45.1 and CD82KO, CD45.2) in the peripheral blood recipient mice. (F) The percentage of donor cell repopulation of peripheral blood collected monthly from tail bleeds. Donor cell chimerism (WT, CD45.1 and CD82KO, CD45.2) status measured via flow cytometry. Error bars, SEM; n = 7 mice per strain (***p < 0.001 and ****p < 0.0001). (G) Flow cytometry analysis of the percentage of donor immune cells (B-cells [B220], T-cells [CD3], and myeloid cells [Gr1/Mac1]) from donor population in F (*p < 0.05 and **p < 0.01).

