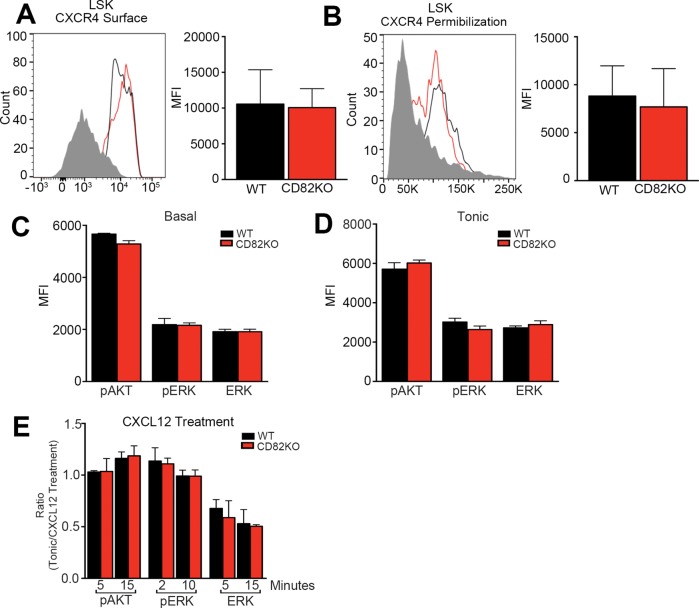
FIGURE 4:
CD82KO does not impact CXCR4 expression or activity. Representative histograms of (A) surface and (B) total (permeablized) CXCR4 expression of bone marrow HSPCs from WT and CD82KO mice. Flow cytometry analysis measured the mean fluorescence intensity (MFI) of CXCR4 on the LSK population. Phosphoflow cytometry analysis of (C) basal and (D) tonic (1 h serum starvation) conditions to assess the mean fluorescence intensity (MFI) of pAKT, pERK, and total ERK signaling of the LSK population. n = 3 mice per strain. (E) Phosphoflow cytometry analysis of SDF-1 treatment at various time points post 1 h of serum starvation to assess pAKT, pERK, and total ERK signaling of the LSK population. Quantification ratio calculated by dividing tonic signaling by SDF-1 treatment conditions. n = 3 mice per strain.

