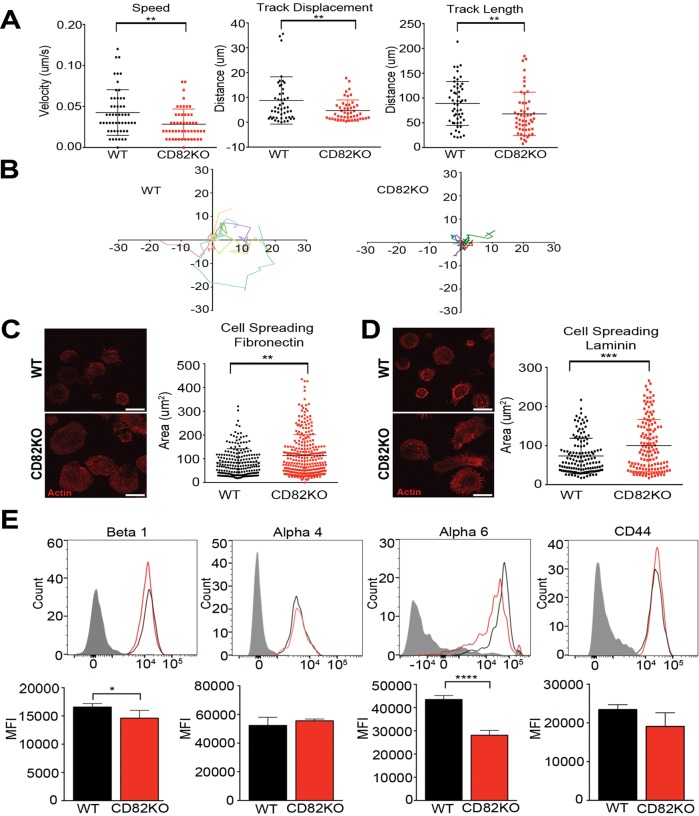
FIGURE 5:
CD82KO HSPCs display decreased migration and increased cell spreading. (A) Live-cell confocal imaging analysis of HSPC migration from WT and CD82KO bone marrow. Imaris imaging software was used to assess track speed, track displacement, and track length. Error bars, SEM; n = 2 independent experiments (**p < 0.01). (B) Rose plots were generated using the WT and CD82KO HSPC track length coordinates. Cell spreading potential of isolated WT and CD82KO HSPCs plated on (C) fibronectin and (D) laminin. Representative images show actin staining used to quantify HSPC area using ImageJ software. Error bars, SEM; n = 2 independent experiments (**p < 0.01 and ***p < 0.001). (E) Representative histograms of surface adhesion molecule expression of bone marrow HSPCs from WT and CD82KO mice. Flow cytometry analysis measuring the mean fluorescence intensity (MFI) of each adhesion molecule on the LSK population. Error bars, SEM; n = 3 mice per strain (*p < 0.05 and ****p < 0.0001).

