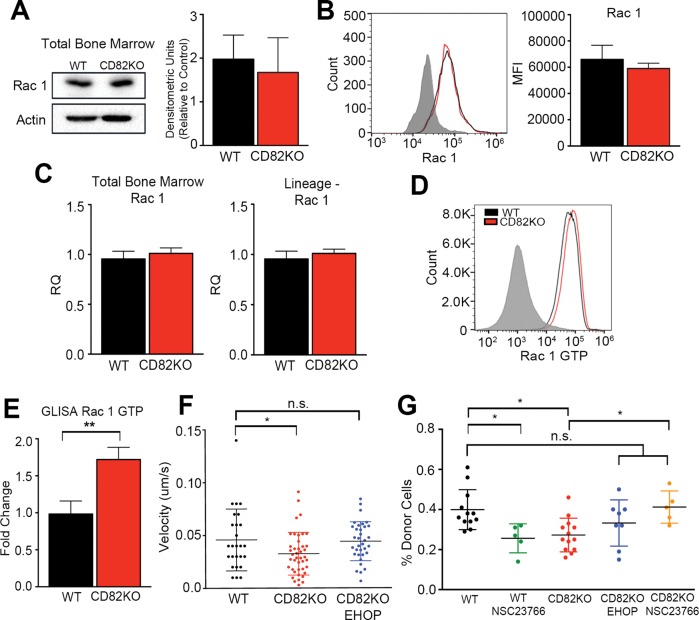
FIGURE 6:
Rac1 hyperactivity in the CD82KO HSPCs contributes to diminished HSPC homing. (A) Western blot analysis of WT and CD82KO total bone marrow measuring Rac1 expression. Densitometry was used to quantify Rac1 expression relative to an actin control. n = 3 independent experiments. (B) Representative histogram of surface Rac1 expression. Flow cytometry analysis measured the MFI of Rac1 on the LSK population. n = 3 mice per strain. (C) Rac1 mRNA expression of total bone marrow and FACS-sorted Lineage-negative cells using real-time qPCR. Rac1 expression was normalized to GAPDH to obtain relative quantification (RQ) values. n = 3 independent experiments. (D) Representative histogram of Rac GTP expression. Flow cytometry analysis measured Rac GTP on WT and CD82KO lineage-negative bone marrow cells. (E) Rac1 activity of WT and CD82KO lineage-negative cells measured using a small G-protein enzyme-linked immunosorbent assay (GLISA). Quantification represents fold change relative to WT. Error bars, SEM; n = 3 independent experiments (**p < 0.01). (F) Live cell confocal imaging analysis of HSPC migration from WT and CD82KO bone marrow. CD82KO HSPCs were treated with EHOP-016 1 h prior to migration. Imaris software was used to assess track speed. Error bars, SEM; n = 2 independent experiments. One-way ANOVA (*p < 0.05 and n.s. nonsignificant). (G) The percentage of total bone marrow cells homed within bone marrow 16 h postinjection. Total bone marrow were treated with EHOP-016 or NSC23766 1 h prior to injection. Donor cell chimerism (CD45.2) status was measured via flow cytometry. Error bars, SEM; n = 5–13 mice per strain, one-way ANOVA (*p < 0.05 and n.s. nonsignificant).

