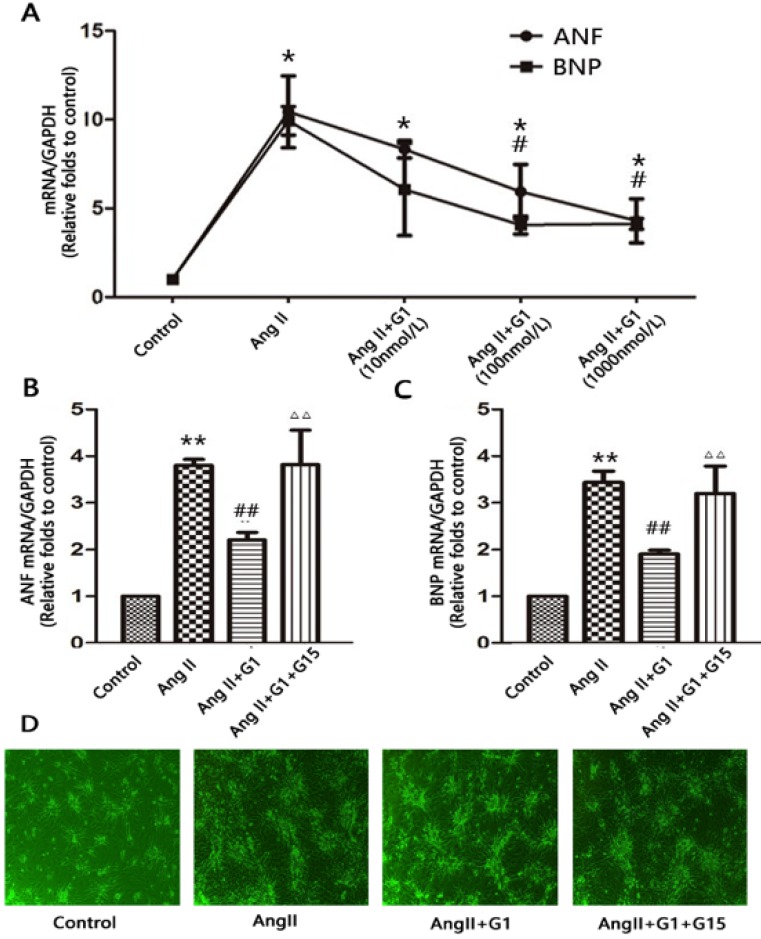
Figure 2.
GPER1 activation attenuates Ang II-induced cardiomyocyte hypertrophy. (A) ANF and BNP mRNA expression levels in different concentrations of G1. (B-C) ANF and BNP mRNA expression levels in four groups. (D) Microscope picture of myocardial cells. Data are expressed as the mean±SEM (n=3). *P<0.05 versus control, **P<0.01 versus control, #P<0.05 versus Ang II, ##P<0.01 versus Ang II, △△P<0.01 versus Ang II+G1. ANF: atrial natriuretic factor, BNP: brain natriuretic peptide, G1: a GPER1 agonist, G15: GPR30 antagonist, Ang II: angiotensin II.

