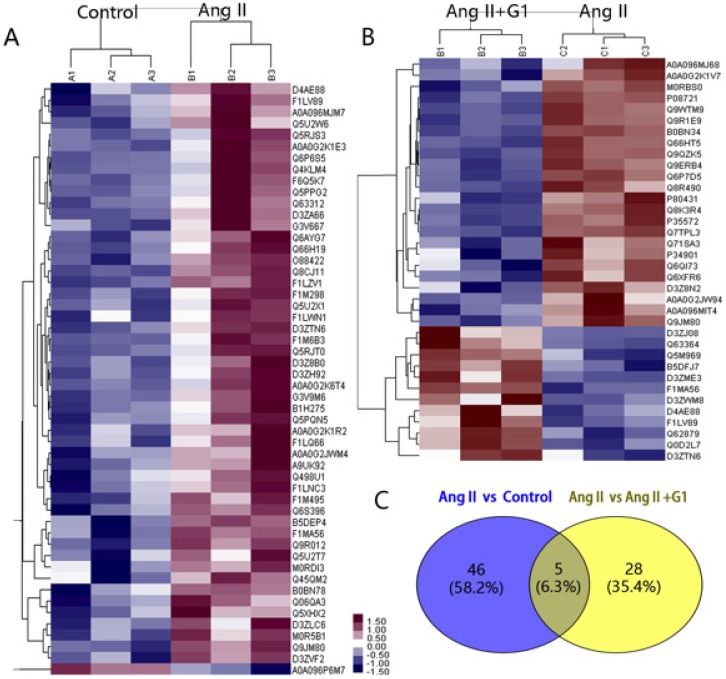
Figure 3.
Protein mass spectrometry results from cardiomyocytes. (A) Cluster analysis result of Control and Ang II groups. (B) Cluster analysis result of Ang II+G1 group and Ang II groups. (C) Wayne diagram shows the difference analysis. Data are expressed as the mean±SEM (n=3). A1, A2, A3: protein expression in three repeated control groups. B1, B2, B3: protein expression in three repeated Ang II-treated cells. C1, C2, C3: protein expression levels in three repeated Ang II+G1 treated cells. Ang II: angiotensin II. Red indicates high expression level and green indicates low expression level. The darker color means the differences are more significant.

