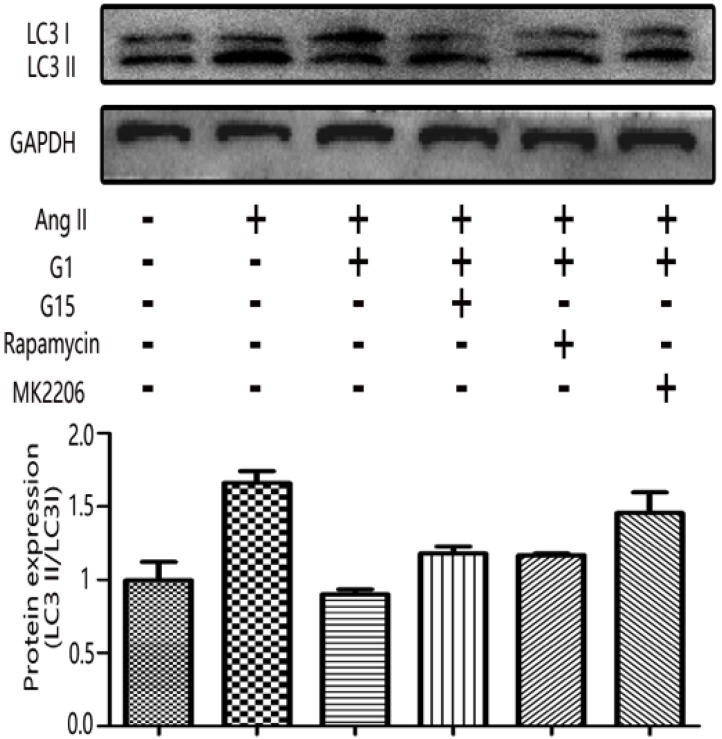
Figure 6.
GPER1-mediated anti-cardiomyocyte hypertrophy triggers autophagy. Western blot and quantitative analysis of cardiac LC3I and LC3II expression. Data are expressed as the mean±SEM (n=3). **P<0.01 versus control, ##P<0.01 versus Ang II, △△P<0.01 versus Ang II+G1. G1: a GPER1 agonist, G15: GPR30 antagonist, MK2206: protein kinase B inhibitor, Ang II: angiotensin II, microtubule-associated protein 1 light chain 3-II (LC3II), microtubule-associated protein 1 light chain 3-I (LC3I).

