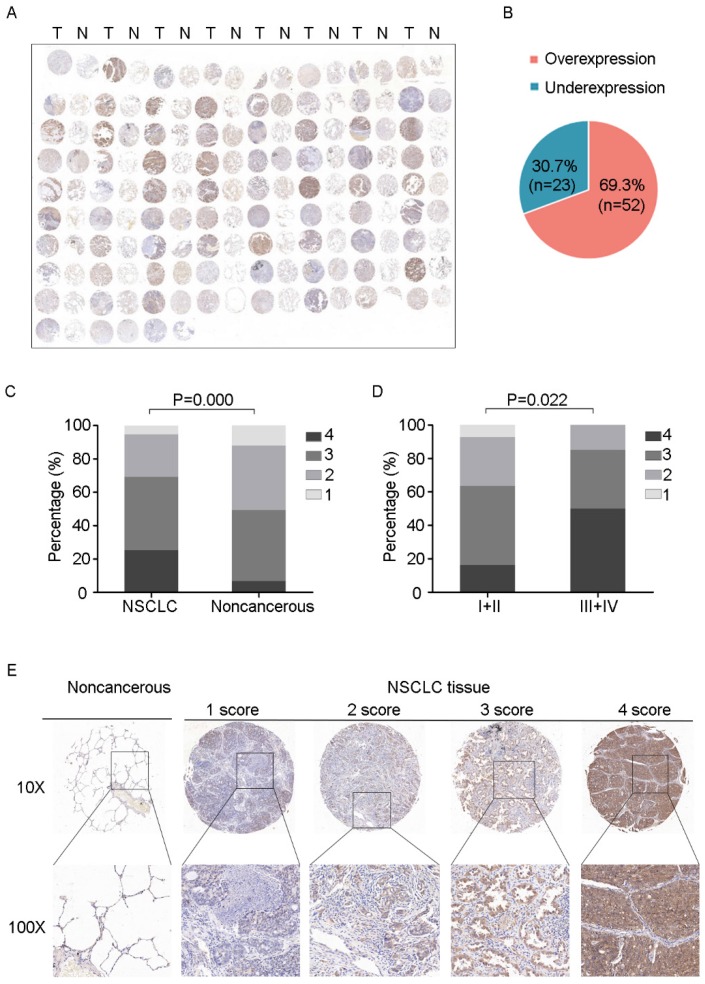
Figure 7.
IHC images with differential expression levels of PSPH between lung cancer and adjacent noncancerous tissue. A. Tissue microarray images reflect PSPH protein expression level in 75 paired lung adenocarcinoma tissues (T) and adjacent noncancerous tissues (N). B. The pie chart represents the proportions of NSCLC samples showing PSPH overexpression and underexpression. C. PSPH was overexpressed in NSCLC tissues compared with the noncancerous tissues (P value =0.000). D. Association between PSPH expression patterns and clinical stages of NSCLC (P value =0.022). The patients were classified into tumor metastasis negative and positive groups (lymph node metastasis and/ or distal metastasis). E. Representative IHC images of the express of PSPH between lung cancer tissues and their adjacent noncancerous tissues. Score was measured by the percentage of positive cells with the following staining intensities: less than 25% scored “1”; 25-49.9% scored “2”; 50- 74.9% scored “3”; and more than 75% scored “4”.

