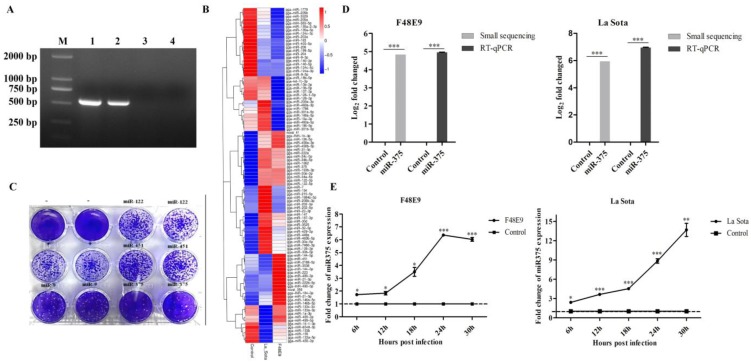
Figure 1.
NDV infection up-regulated miR-375 expression in both chicken embryos and DF-1 cells. (A) PCR detected the NDV in each samples, 1-4 were representative the sample of F48E9, La Sota or PBS infection and negative control, M representative DL5000 DNA Marker. (B) The heatmap of differentially expressed miRNAs in NDV-infected chicken embryonic tissues by small RNA-Seq. (C) Plaques of F48E9 after the overexpression of miR-375, miR-9, miR-122, and miR-451. (D) miR-375 expression levels were assessed by RNA-Seq and RT-qPCR with F48E9 or La Sota infection. (E) Relative expression levels of miR-375 for various infection times were detected in DF-1 cells during F48E9 or La Sota infection. Control representative uninfected group. Statistical analyses were performed in GraphPad Prism using unpaired 2-tailed t-tests: *P < 0.05, **P < 0.01, ***P < 0.001, ns. indicates no significant difference.

