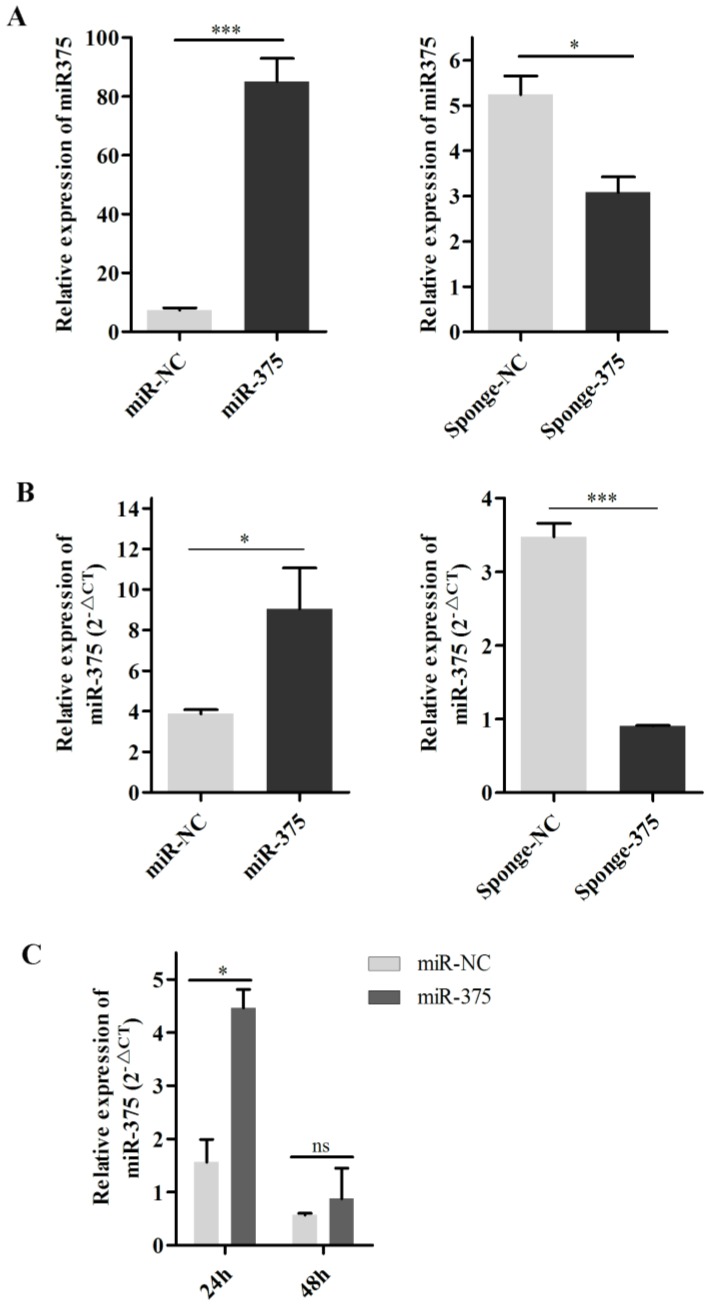
Figure 6.
Secretion of miR375 into the supernatant. miR-375 levels in cells (A) and supernatants (B) after Hep2 cell transfection with the plasmid miR-375, miR-NC sponge-375, or sponge-NC for 24 h. (C) miR-375 was degraded in the supernatant at 37°C for 24 h or 48 h by RT-qPCR. Results are presented as means ± SEM (n = 3). Statistical analyses were performed in GraphPad Prism using unpaired 2-tailed t-tests: *P < 0.05, **P < 0.01, ***P < 0.001, ns. indicates no significant difference.

