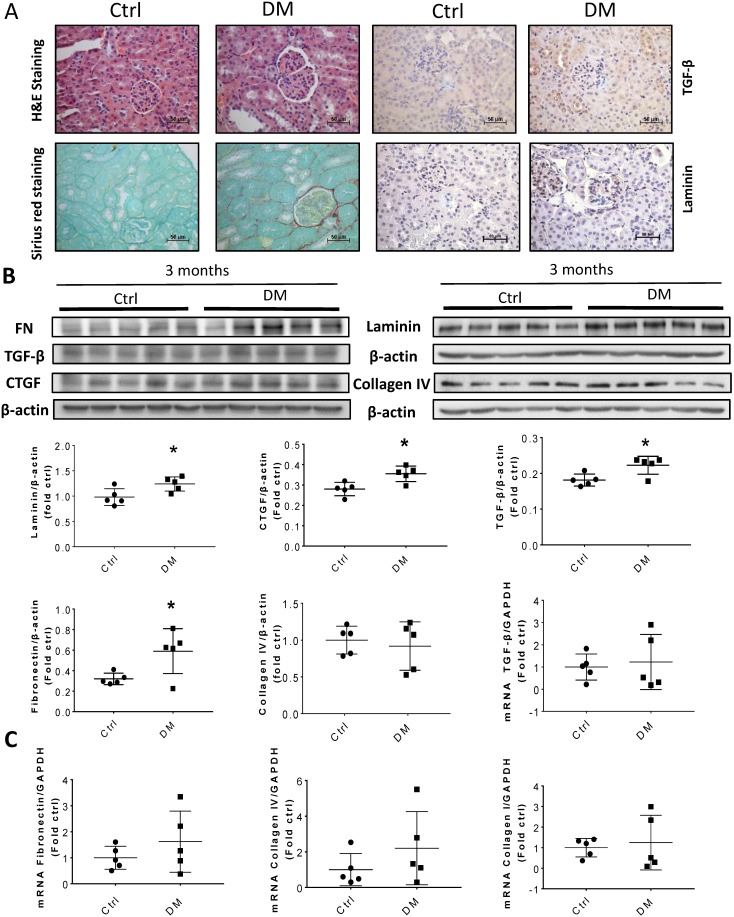
Figure 3.
Kidney fibrosis in T1D mice at three months. (A) Representative H&E (top right two panels), Sirius red staining (bottom right two panels) and representative immunohistochemical staining for TGF-β (top left two panels) and laminin (bottom left two panels) (original magnification, ×40); (B) The protein levels of FN, TGF-β, collagen IV, laminin and CTGF were measured by Western blot and quantified; (C) mRNA levels of fibrosis markers, including TGF-β, FN, collagen I, and collagen IV were examined by RT-PCR, and quantified. Data are represented as mean ± SD (n = 5 in each group, * p < 0.05, Ctrl vs DM).

