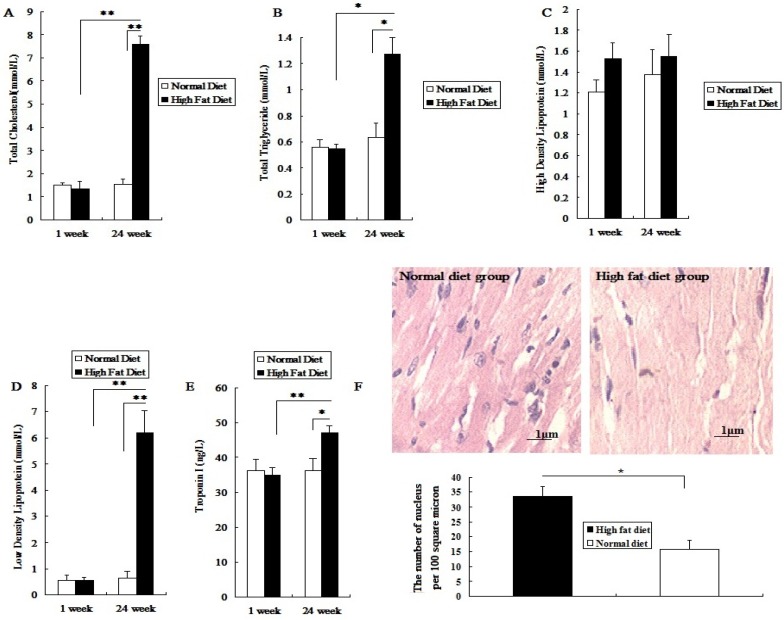
Figure 1.
Establishment and assessment of hyperlipemic rat model. The serum was collected after high-fat diet for 24 weeks. A, the value of TC in serum; B, the value of TG in serum; C, the value of HDL-C in serum; D, the value of LDL-C in serum; E, the value of cTn-I in serum; F, The HE staining of myocardial tissue. The data are expressed as mean ± SD (n=7), * P <0.05 and ** P <0.01 vs the normal diet group. The pathological tissue block was sampled from the rat's left ventricle, and the sampling site for each rat should be same.

