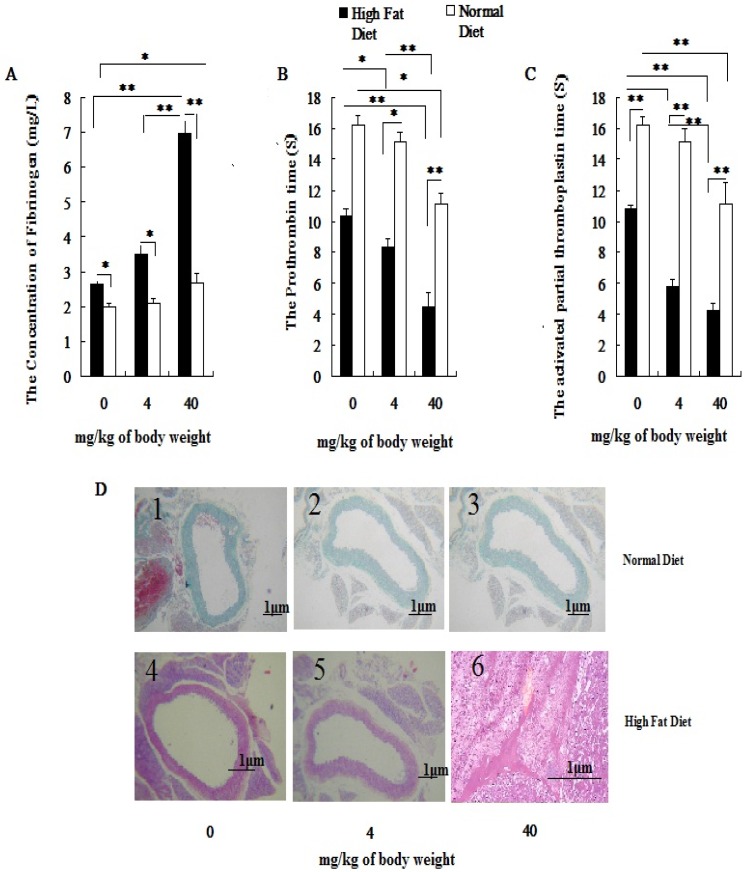
Figure 2.
Influence of exposure to PM2.5 on the rat's blood coagulation system under the different physiological status. The plasma was collected from the rat fed on high fat diet at the time point of 24 h after the last dripping of PM2.5. A, the value of FIB in plasma; B, the value of PT in plasma; C, the value of APTT in plasma; D, HE staining of rat blood vessels. The date are shown as mean ± SD (n=7), * P<0.05 indicating statistically significant difference; ** P<0.01 indicating very significant difference. The blood vessels were taken from the aortic arch.

