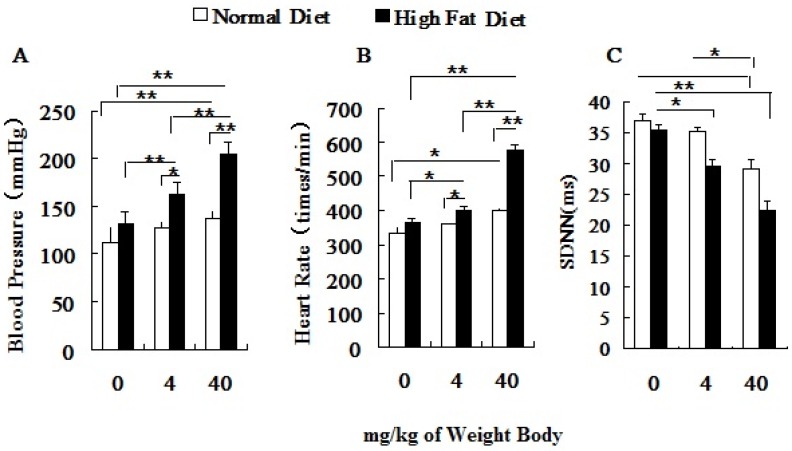
Figure 3.
Influence of PM2.5 on the variation of blood pressure and heart rate. ECG was measured at 24h after the last dripping. A, blood pressure; B, heart rate; C, SDNN; The data are presented as mean ± SD (n=7); * P <0.05 indicating statistically significant difference; ** P <0.01 indicating very significant difference.

