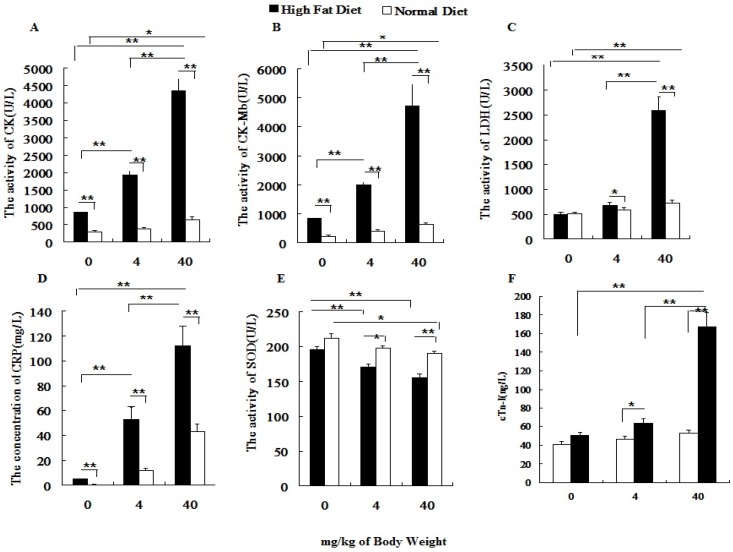
Figure 4.
Influence of PM2.5 exposure on serum biochemical indexes at different status. Blood sample was collected from abdominal aorta at 24h after the last exposure to PM2.5. A, the activity of CK in serum; B, the activity of CK-MB in serum; C, the activity of LDH in serum; D, the concentration of CRP in serum; E, the activity of SOD in serum; F, the concentration of cTn-I in serum; The data are presented as mean ± SD (n=7)

