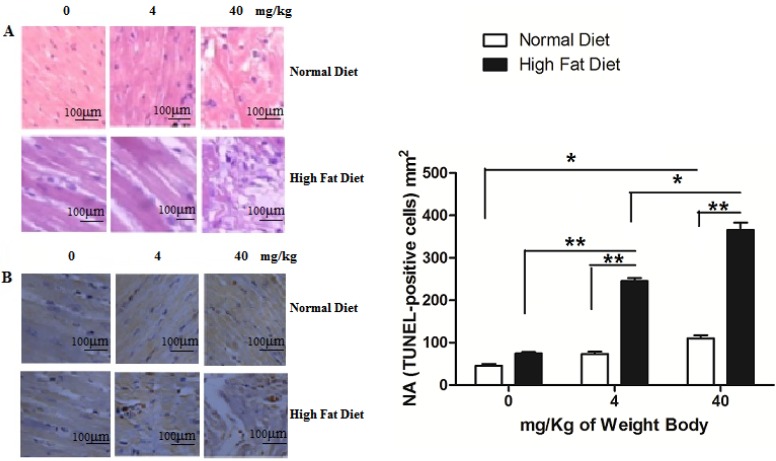
Figure 5.
Pathological changes of myocardial tissue after PM2.5 exposure. A, HE staining of rat myocardial tissue; B, The TUNEL staining of rat myocardial tissue. The data are shown as mean ± SD (n=7), * P<0.05 indicating a statistically significant difference, and ** P<0.01 indicating a very significant difference. Pathological samples were obtained from the rat's left ventricle, and the sampling site for each rat was the same.

