Figure 2.
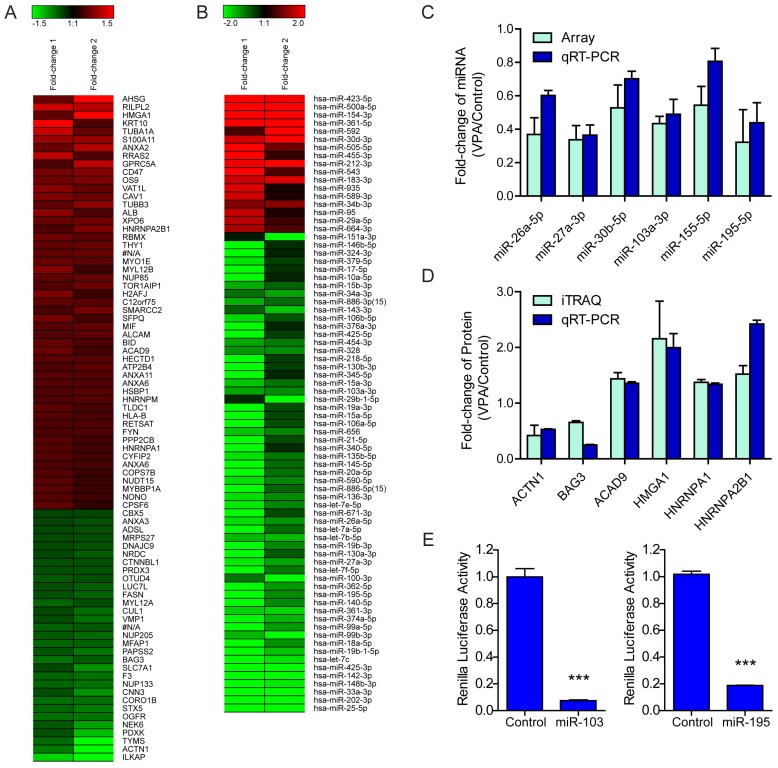
Regulation of VPA on LX2 miRNA and protein expression (A) Heatmap representation of the deregulated proteins in 2.5mM VPA treated versus untreated LX2 cells. Only differentially expressed proteins pass Avg VPA/Control filtering (V/C ≥ 1.333) were included. Red: up-regulated; Green: down-regulated. (B) Heatmap representation of the deregulated miRNAs in 2.5mM VPA treated versus untreated LX2 cells. Only differentially expressed miRNAs passing fold change filtering (fold change ≥ 2.0) were included. (C) Comparison of expression levels of 6 miRNAs in VPA treated LX2 cells by microarray and qRT-PCR assay. The correlation coefficient r = 0.8772, P value (two-tail) = 0.0217. (D) Comparison of expression levels of 6 proteins and encoding genes in VPA treated LX2 cells by iTraq and qRT-PCR assay respectively. The correlation coefficient r = 0.8469, P value (two-tail) = 0.0334. (E) Relative renilla luciferase activity of psiCHECK-2/HMGA1MRE103a×3 or psiCHECK-2/HMGA1MRE195×3 in the presence of miR-103a mimic or miR-195 mimic in 293T cells, the 293T cells co-transfected with miR-neg served as control, normalized to firefly luciferase activity. *** P < 0.001.

