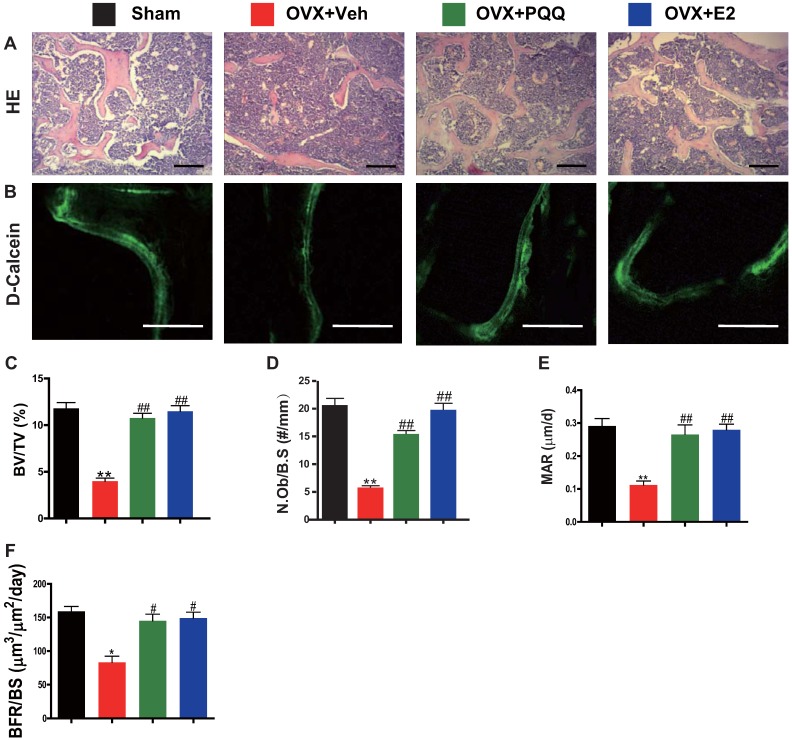
Figure 2.
Effects of PQQ and estrogen on osteoblastic bone formation in OVX mice. (A) Representative micrographs of decalcified distal femur paraffin sections stained with H&E. (B) Representative micrographs of double calcein labeling. Scale bars represent 50 μm in A and B. Histomorphometric analysis for (C) trabecular bone volume/tissue area (BV/TV, %), (D) N.Ob/B.S (#/mm), (E) MAR. (F) BFR. Data represented as mean ±SEM, n=15. **: P < 0.01, vs. the Sham control group. ##: P<0.01, vs. the OVX-Veh group.

