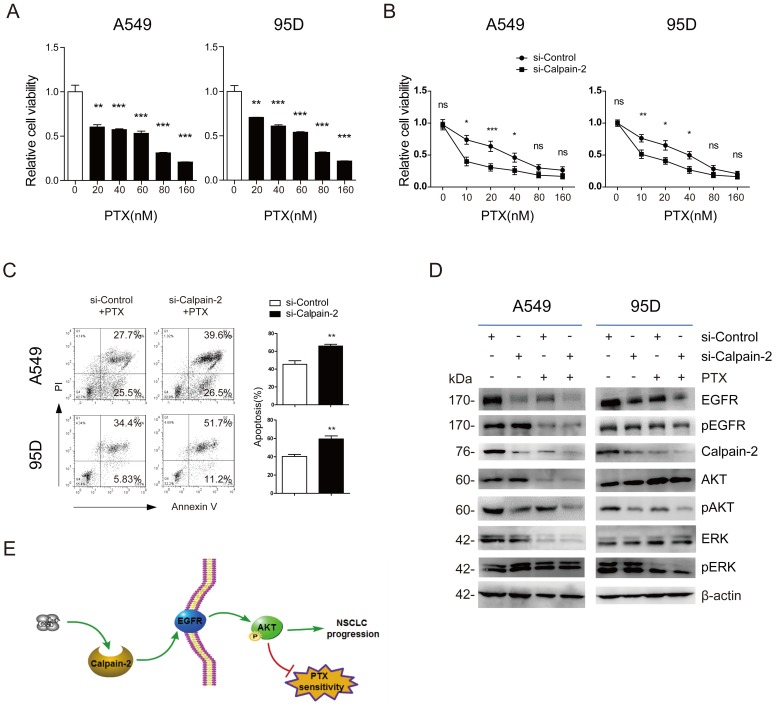
Figure 4.
Calpain-2 promotes the chemoresistance to paclitaxel. (A) The cells were treated with different doses of PTX (0, 10, 20, 40, 80 and 160 nM) for 48 h. The IC50 value of A549 and 95D cells was 53.06±5.26 nM and 44.60±8.02 nM, respectively. (B and C) The cells transfected with si-control or si-Calpain-2 were treated with PTX for 24 h. Cells viability and apoptosis were evaluated by the CCK‑8 and Annexin V/ PI assays. (D) Western blot was performed to analyze the difference of related protein expression level after knockdown of Calpain-2 and treatment of PTX. β-actin was used as an internal reference. (E) Graph summarized the mechanism for Calpain-2 to promote the progression of NSCLC and chemoresistance to PTX. (ns: no significance, *p <0.05, **p <0.01, ***p < 0.001)

