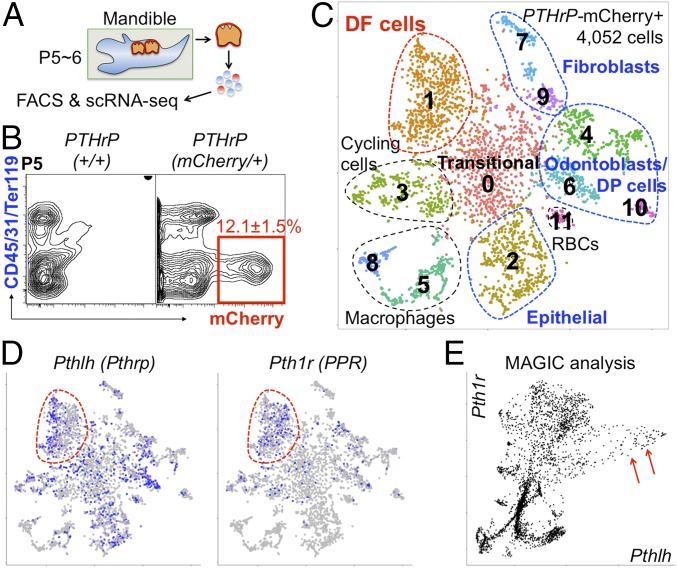
Fig. 1.
Characterization of PTHrP-mCherry+ DF cells. (A and B) PTHrP-mCherry expression in PTHrP+/+ and PTHrPmCherry/+ DF cells at P5. (C and D) t-SNE–based visualization of major classes of FACS-sorted PTHrP-mCherry+ single cells at P6 (clusters 0–11). Cluster 0, transitional cells; cluster 1, DF cells; cluster 2, epithelial cells; cluster 3, cycling cells; clusters 4, 6, and 10, odontoblasts and dental papilla (DP) cells; clusters 5, 8, and 11, impurified cells; clusters 7 and 9, fibroblasts. Dots indicate individual cells; color indicates cell type. (D) Pthlh and Pth1r expression. Blue, high expression; gray, no expression; red contour, DF cells. (E) MAGIC imputation analysis showing the Pthlh-Pth1r relationship (DF cells). Red arrows indicate PthlhhighPth1r+ cells.

