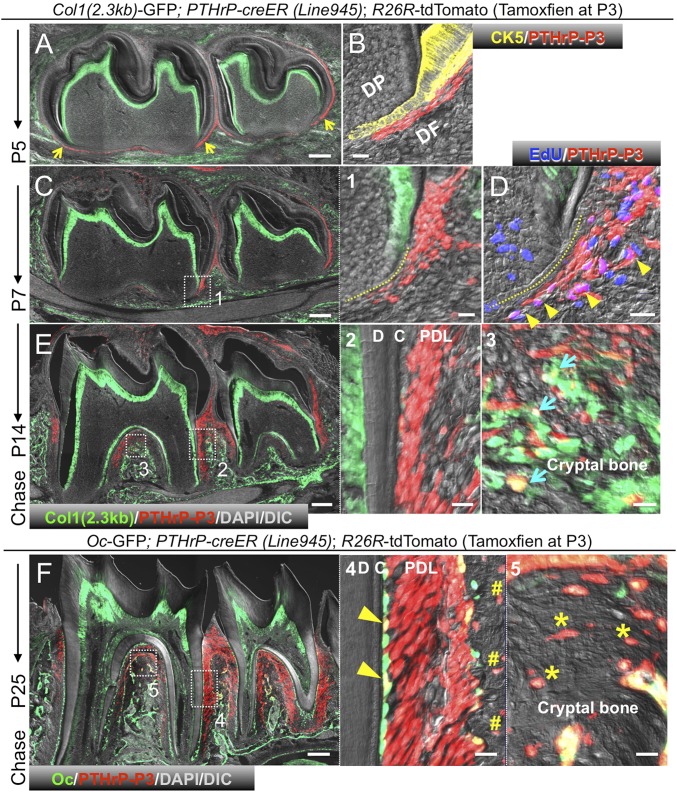
Fig. 2.
PTHrP-creER marks DF mesenchymal progenitor cells in vivo. (A–F) Lineage tracing of P3 PTHrP-creER+ DF cells. Yellow arrowheads in A indicate tdTomato+ DF cells in periapical areas. (B) Cytokeratin 5 (CK5) staining. (C) Yellow dotted line in (1) denotes HERS. (D) EdU was administered shortly before analysis. Arrowheads in D denote EdU+tdTomato+ DF cells. (E) Blue arrows in (3) indicate Col1-GFP+tdTomato+ osteoblasts in cryptal bones. (F) Yellow arrowheads in (4) indicate GFP+tdTomato+ cementoblasts on root surface. Pound signs in (4) denote tdTomato+ osteocytes in interseptic cryptal bones. Asterisks in (5) indicate tdTomato+ osteocytes in interradicular cryptal bones. C, cementum; D, dentin. PDL, periodontal ligament. [Scale bars: 200 µm (Left), 20 µm (Right).]

