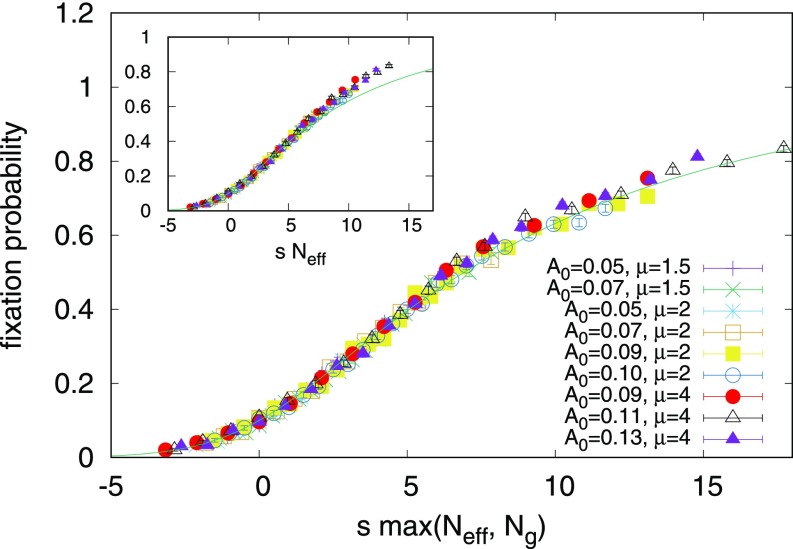
Fig. 4.
When we plot the measured fixation probabilities against times the larger effective population size of our two approximations, Eqs. 7 and 9, our data collapse to a master curve. The agreement with our sine wave simulations suggests that we have identified how the fixation varies with and for this parameter regime. Error bars associated with 2,000 independent realizations are shown. for all data points shown, avoiding the crossover to well-mixed behavior seen at high in Fig. 2. (Inset) When plotted as a function of the quasi-neutral theory only, Eq. 7, we see a departure from the theory at high values of , which motivates the high approximation given by Eq. 9.

