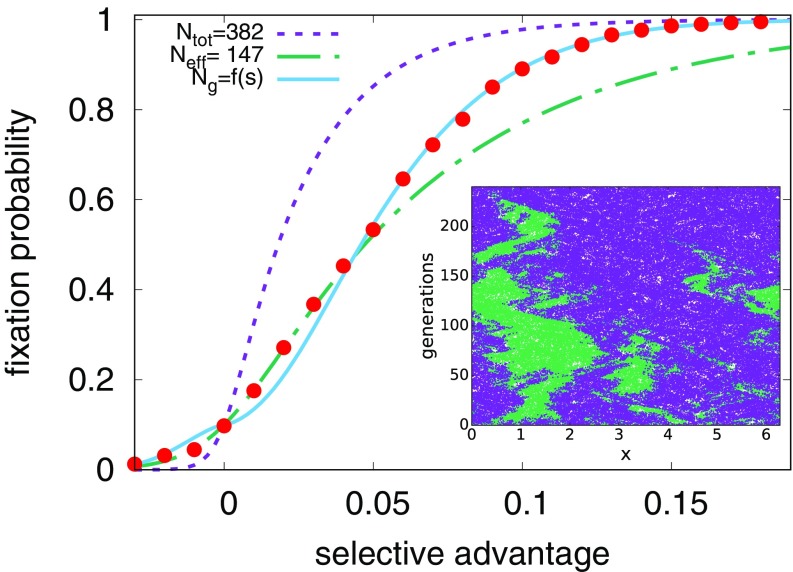
Fig. 5.
The fixation probability (red circles) for an initial condition with a random 10/90 mixture of two species advected by a shell model with amplitude and growth rate , for variable selective advantage (). The purple line (short dashes) shows Eq. 3, the no-flow result, for the measured number of organisms in the simulation, . The green line (short and long dashes) gives the prediction of Eq. 7, valid in the limit of small with . The blue line (solid) gives the prediction of Eq. 9 for the large case, with a selective advantage-dependent population size. Error bars inferred from 2,000 independent simulations are too small to be visible. (Inset) A single realization for a 50/50 mixture of two neutral species ().

