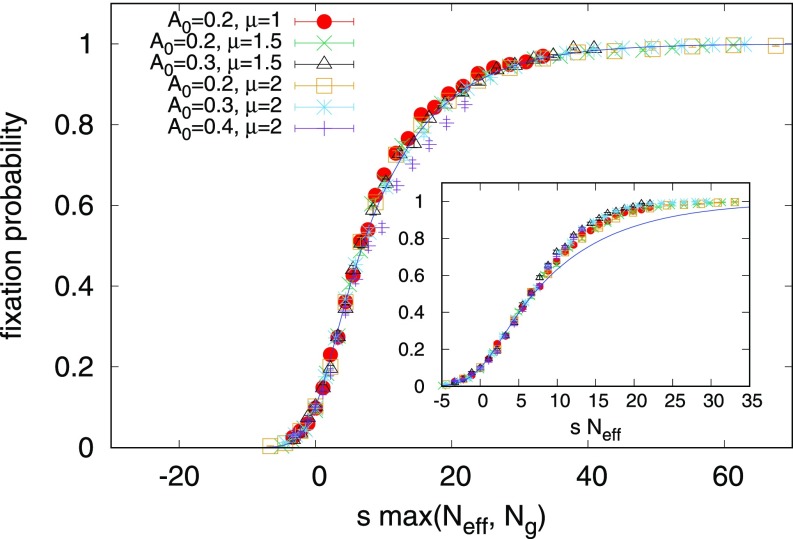
Fig. 6.
When we plot the measured fixation probabilities against times the larger effective population size of our two approximations, Eqs. 13 and 15, our data collapse to a master curve. The agreement with our shell model simulations suggests that we have identified how the fixation varies with and for this parameter regime. Error bars associated with 2,000 independent realizations are shown. for all data points shown, avoiding the crossover to localized behavior. These parameters ensure that approximate spatial uniformity is maintained. (Inset) When plotted as a function of the quasi-neutral theory only, Eq. 13, we see a departure from the theory at high values of , which motivates the high approximation given by Eq. 15.

