Fig. 1.
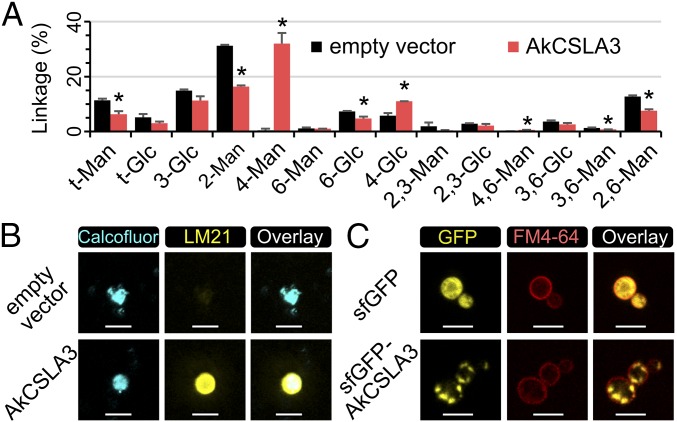
Yeast cells expressing AkCSLA3 accumulate plant HM in their walls. (A) Glycosidic linkage analysis of Pichia wall AIR. Values represent molar percentage of total carbohydrates detected. Data show mean + SD of two independent transformants for each strain. Asterisks indicate significant changes (two-tailed t test, P < 0.05) between the strains. (B) Yeast wall polysaccharides with stained with calcofluor, a general β-glucan dye, and immunolabeled with the HM-binding LM21 antibody. (C) Subcellular localization of AkCSLA3 enzymes in Pichia cells. The plasma membrane was stained with the FM4-64 dye. The signal intensity of all channels for the fusion protein sfGFP-AkCSLA3 sample was increased postacquisition, relative to sfGFP control. (Scale bars, 5 µm.)

